
U.S. CPI fell 0.4%—so why are business costs still sticky? The Beige Book margin gap
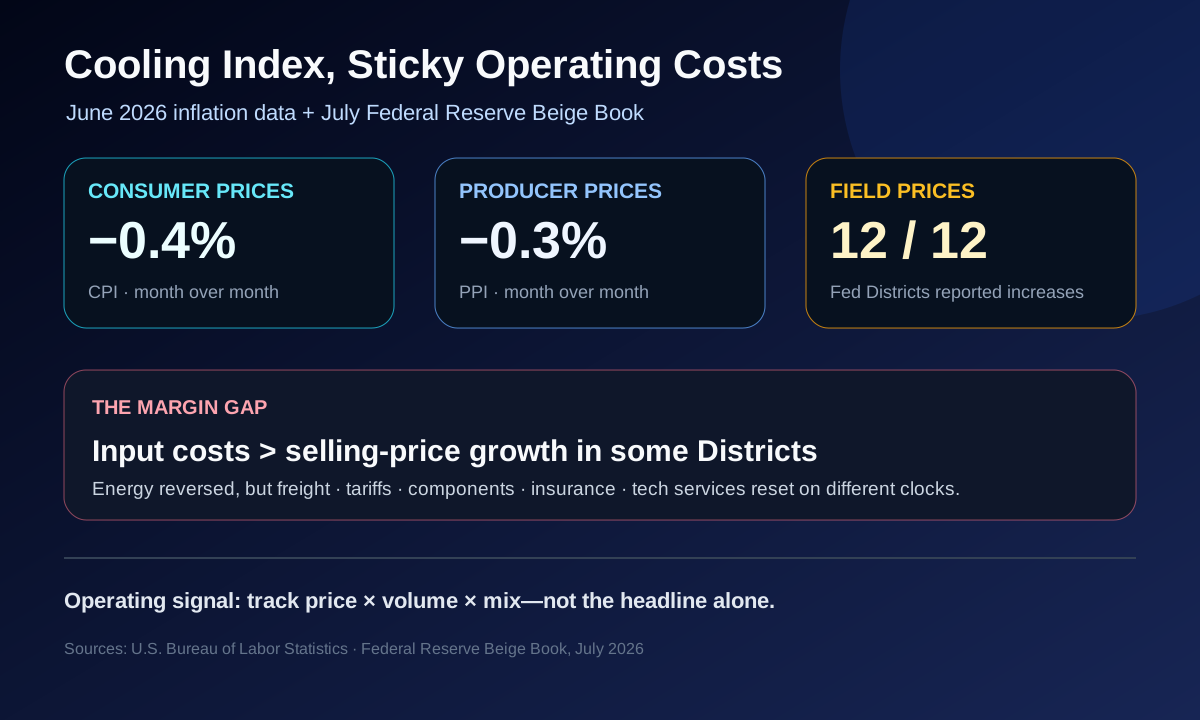
U.S. consumer prices fell 0.4% in June from May, and producer prices fell 0.3%. Read alone, those numbers look like a rapid end to the cost shock. The Federal Reserve’s July Beige Book, released later on the PPI publication day, shows a different operating picture: prices rose in every District—moderately in nine, robustly in two, and slightly in one.
There is no contradiction. The monthly CPI and PPI declines leaned heavily on a sharp energy reversal. A company’s quote sheet still contains freight, tariffs, electronic components, insurance, technology services, and raw-material contracts that reset on different clocks. The useful question is not whether “inflation is over,” but who actually received the lower cost and who absorbed it because customers pushed back.
Confirmed facts: cooler indexes, broad field-level pressure
- The Bureau of Labor Statistics reported that June CPI fell 0.4% on a seasonally adjusted monthly basis, the largest decline since April 2020. The index was still 3.5% above a year earlier. Core CPI was unchanged for the month and up 2.6% year over year.
- Energy drove the monthly decline: the energy index fell 5.7% and gasoline 9.7%. Even after that drop, energy was 15.7% and gasoline 26.7% above June 2025. Food rose 0.2% for the month and shelter 0.1%.
- June final-demand PPI fell 0.3% month over month but remained 5.5% higher year over year. Final-demand goods fell 1.4% on lower energy, while services rose 0.2%. The index excluding food, energy, and trade services rose 0.1% for the month and 5.1% for the year.
- The Beige Book covered information gathered from late May through July 6. Activity grew at a slight-to-moderate pace in 11 Districts and was flat in one. Price growth continued in all 12, though it was the same or slower than in the prior report.
- Employment rose meaningfully in five Districts and changed little in seven. Skilled technicians and tradespeople remained hard to find, while some firms expanded AI use for screening, hiring, and productivity.
- The national summary explicitly noted that selling prices grew more slowly than input costs in a couple of Districts, squeezing margins. It also reported a small deterioration in consumer loan quality and repeated examples of trading down and weaker discretionary spending.
Interpretation: an inflation index and a margin are different objects
The confirmed evidence ends there. The interpretation is that monthly CPI and PPI compress economy-wide price changes into averages, while a margin is the spread between the exact basket a company buys and the price its customers accept. An energy-led index decline can coexist with sticky logistics, tariff, insurance, cloud, and data-processing bills.
New York contacts reported strong input-price increases from fuel, freight, and electronic components while selling-price gains stayed moderate. Richmond producers often held prices and absorbed higher costs. San Francisco retailers raised some prices, but service firms saw customer pushback. In Boston, value hotels kept rates flat despite higher costs, and grocery customers switched from beef to chicken and pork.
It is therefore premature to conclude either that rate cuts will immediately repair margins or that every cost must keep rising. The data show disinflation in the aggregate; the contacts show residual costs and weaker pass-through. Gross margin, volume, discounting, mix, and payment days matter before the policy forecast does.
Market narrative: inflation relief meets price resistance
Market coverage and rate-focused communities quickly translated CPI at -0.4% and PPI at -0.3% into less need for additional tightening. Reuters highlighted that price growth was the same or slower in every District. That is a valid directional signal, but a one-month energy reversal does not guarantee a structural decline in operating costs.
The qualitative signal asks a different question. Consumers are buying cheaper substitutes, reducing units per trip, keeping cars longer, and spending more on repairs. Firms are adding AI productivity tools while holding head count or hiring selectively. Demand is not simply disappearing; it is moving toward lower prices, clearer value, and shorter commitments.
Second-order effects for small teams, founders, and investors
Change the offer before cutting every price
Customers compare pack size, billing interval, and essential features. A value tier, smaller bundle, or monthly contract can preserve more margin than a blanket discount.
Supplier reset lags will widen
Spot energy may fall before freight, components, insurance, and cloud contracts reprice. Track renewal dates and index clauses before counting CPI relief as savings.
AI expense arrives before the payoff
Tool spend is immediate; process redesign and revenue gains lag. Measure cycle time, error rates, and response speed instead of seats purchased.
Trading down widens segment gaps
Premium spending can remain resilient while middle- and lower-priced customers reduce both frequency and basket size. Averages can hide the vulnerable cohort.
Credit quality can move before rates
Commercial credit was stable, but consumer loan quality ticked down. Consumer businesses should pair revenue with refunds, delinquencies, and authorization rates.
Risks and counterarguments
The Beige Book is qualitative contact intelligence, not a representative national survey. It is useful at turning points but cannot be converted into population shares.
If lower energy persists, freight and materials may follow with a lag. Today’s margin pressure is not necessarily permanent.
Middle East conflict and tariffs could reaccelerate supply costs, so June’s monthly decline should not be extrapolated mechanically.
Trading down can also reflect competition and product innovation. Verify cohort-level volume and retention before labeling it a recession signal.
This week’s pricing and cash-flow checklist
Decompose revenue into price, volume, and mix; verify that a higher average ticket is not masking weaker units.
Map renewal dates, indexation, minimum commitments, currency exposure, and fuel surcharges for the top ten costs.
Stress a 3% price increase, 5% unit decline, and 15-day receivables delay in the same 13-week cash-flow model.
Test a value tier or smaller bundle, including support and payment costs in contribution margin.
Evaluate AI with weekly throughput, rework hours, response time, and churn—not license count.
After CPI and PPI, watch retail sales, consumer credit, and company commentary on gross margin, price, and volume.
This article provides economic and market context for informational purposes only and is not financial advice. Make investment, pricing, hiring, and operating decisions independently based on your cash flow, horizon, and risk tolerance.
Sources
- Federal Reserve — Beige Book, July 2026 national summary
- Federal Reserve — New York District, July 2026
- Federal Reserve — Boston District, July 2026
- Federal Reserve — Richmond District, July 2026
- Federal Reserve — San Francisco District, July 2026
- U.S. Bureau of Labor Statistics — Consumer Price Index, June 2026
- U.S. Bureau of Labor Statistics — Producer Price Index, June 2026
- Reuters — Economic activity on the rise and inflation may be improving