The Hormuz Shock Is Now a Fed Problem: Watch Cash Flow Before Oil Prices
The visible market question this week is whether the Federal Reserve will use the June 16-17 FOMC meeting to prepare investors for easier policy. The more useful operating question is narrower: how does an energy chokepoint turn into product prices, supplier quotes, dollar funding costs, and delayed customer payments?
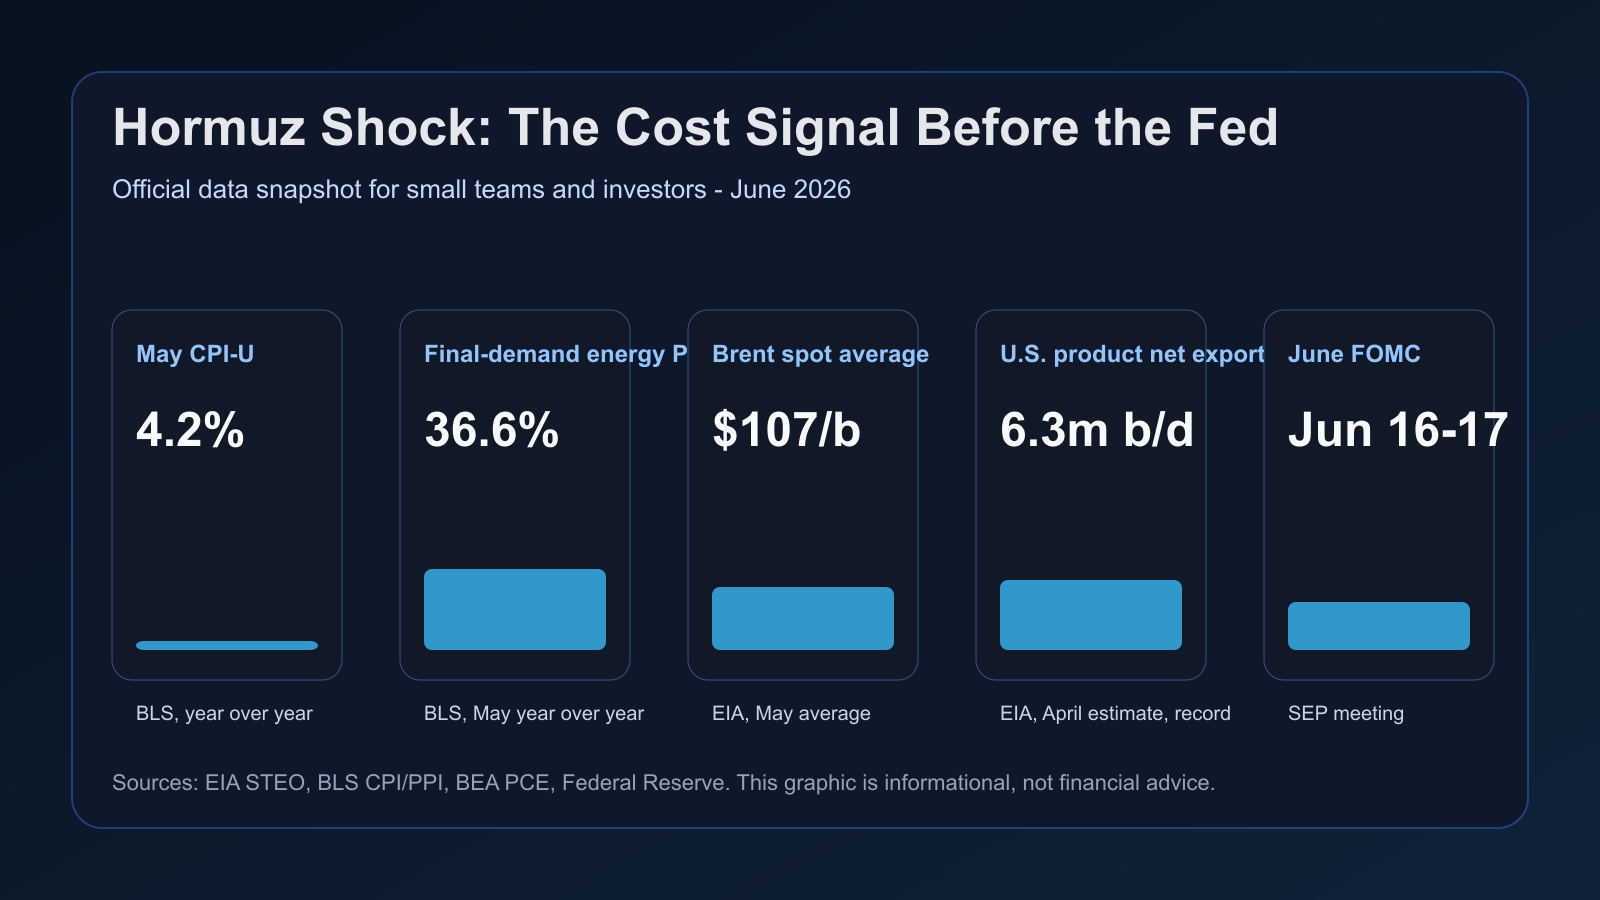
The confirmed data already argues for caution. BLS reported May CPI-U at 4.2% year over year. In the May PPI table, final-demand energy was up 36.6% from a year earlier. EIA put the May Brent spot average at $107 per barrel, while BEA shows the April PCE price index up 3.8% year over year. This is more than a rate-cut timing story; it is a margin and cash-conversion story.
Confirmed facts
| Metric | Confirmed value | Why it matters |
|---|---|---|
| May CPI-U | 4.2% | BLS, year over year |
| Final-demand energy PPI | 36.6% | BLS, May year over year |
| Brent spot average | $107/b | EIA, May average |
| U.S. product net exports | 6.3m b/d | EIA, April estimate, record |
| June FOMC | Jun 16-17 | SEP meeting |
Interpretation: product prices before rate cuts
The most important EIA detail is the changing trade route. In its June Short-Term Energy Outlook, EIA says disruptions around the Strait of Hormuz have pushed buyers toward U.S. supply. U.S. crude oil and petroleum product net exports reached an estimated record 5.8 million barrels per day in April, and petroleum product net exports alone reached an estimated record 6.3 million barrels per day. Diesel and jet fuel are the pressure points because Europe and Asia are replacing volumes formerly supplied through the strait.
Separate confirmed facts from interpretation. The facts are the Hormuz disruption, elevated energy PPI, sticky CPI/PCE readings, and an FOMC meeting that includes a Summary of Economic Projections. The interpretation is that the Fed cannot look only at headline oil. It has to decide whether the shock is temporary, whether it is feeding expectations, and whether the labor or credit side of the mandate is starting to weaken.
The market narrative is split. One camp argues that reports of U.S.-Iran negotiations and weaker oil demand cap the price spike. The other argues that depleted inventories and rerouted refined-product flows make diesel, jet fuel, freight, and supplier quotes slow to normalize. Builders and small funds do not need to guess which story wins. They need pricing, cash, and FX policies that survive both paths.
Practical checklist
- Recalculate dollar-denominated cloud, ads, API, contractor, and hardware costs on a three-month horizon.
- Compare annual prepayment discounts with the value of preserving cash and renegotiation flexibility.
- Add quote-expiry dates and FX clauses to freight, hardware, travel, and outsourced work.
- Investors should watch refined-product margins, product inflation, inflation expectations, and credit spreads together.
- Stress-test a 10-20% revenue delay with a simultaneous 5-10% cost increase instead of assuming immediate rate cuts.
What builders and investors should watch
The second-order effects reach digital businesses. A SaaS company may not buy diesel, but it pays for cloud infrastructure, ads, contractors, travel, devices, and API usage in dollar-linked markets. Customers squeezed by fuel, food, and financing costs may delay upgrades before they formally churn. Conversion rates can weaken quietly while refund requests and downgrade pressure show up first.
There is a counterargument. EIA expects Brent to fall toward a 2027 average of $79 per barrel if flows gradually resume and production recovers. Demand destruction also limits the upper tail of the oil shock. But even in that softer scenario, contracts, freight rates, cloud commitments, and wage expectations repriced in 2026 may not reverse on the same timetable as spot oil.
The practical conclusion is not to trade the FOMC headline. Watch whether the June projections acknowledge a higher energy path, whether the July EIA update lowers product-price pressure, and whether your own payment delays and supplier quotes are already reflecting the shock.
Risks and counterarguments
This article is informational economic commentary, not financial advice or a recommendation to buy or sell securities.