
Samsung’s KRW 89.4tn profit signal: AI memory is now a cost variable for every builder
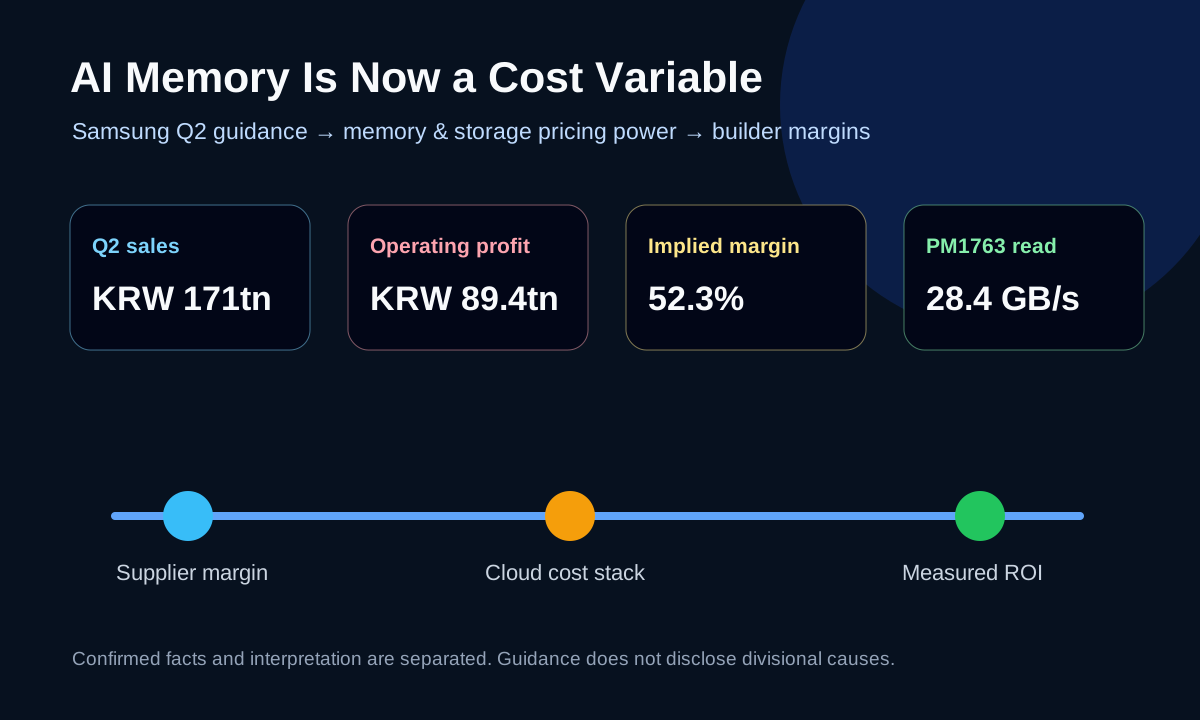
Samsung’s Q2 2026 guidance, a new PCIe 6.0 enterprise SSD, and Micron’s results point to a widening AI infrastructure bottleneck. Here is the operating playbook for small teams.
Confirmed facts: the numbers are extraordinary, but the cause is not yet disclosed
- Samsung Electronics guided to approximately KRW 171 trillion of consolidated Q2 2026 revenue and KRW 89.4 trillion of operating profit. Korean disclosure rules require a single estimate; the underlying ranges were KRW 170–172 trillion and KRW 89.3–89.5 trillion.
- The same release lists Q1 2026 revenue of KRW 133.87 trillion and operating profit of KRW 57.23 trillion. Simple calculations put sequential growth at 27.7% and 56.2%, with an implied Q2 operating margin near 52.3%.
- Q2 2025 reported revenue was KRW 74.57 trillion and operating profit was KRW 4.68 trillion. The new guidance therefore implies year-over-year increases of roughly 129.3% and 1,810.3%. Crucially, guidance does not disclose divisional results or causes. Memory’s contribution remains an interpretation until full results arrive.
- One day later Samsung announced mass production of the PCIe 6.0 PM1763 enterprise SSD. The 16TB version reaches up to 28,400 MB/s sequential reads and 21,900 MB/s writes, while Samsung claims more than 1.8 times the power efficiency of its predecessor.
- Micron provides a cross-check on the broader cycle. It reported fiscal Q3 revenue of $41.46 billion, versus $23.86 billion in the prior quarter and $9.30 billion a year earlier. Product mixes and reporting periods differ, but both releases point toward unusually strong supplier economics.
Interpretation: the AI bottleneck is widening beyond GPUs
The confirmed facts are record guidance and a new enterprise SSD entering mass production. The reasonable inference is that AI infrastructure bottlenecks no longer stop at accelerators. HBM, server DRAM, enterprise NAND, networking, power, and cooling increasingly move as one cost stack.
That is favorable for suppliers with the right product mix and pricing power. Buyers face the mirror image. Even without an immediate cloud list-price increase, pressure can arrive through smaller discounts, larger commitments, scarce high-performance instances, and higher data-movement costs.
Inference workloads turn memory bandwidth and storage I/O into recurring expenses. Falling model-token prices are not enough to prove that total AI costs are falling. Teams must include context length, cache misses, vector storage, log retention, and multimodal data transfer.
Market narrative: supplier margin is not the same as buyer productivity
Markets can read record semiconductor profit as proof that AI productivity is already here. Supplier margin, however, does not prove buyer ROI. It may instead show that demand is growing faster than supply and suppliers are capturing more of the economic surplus.
The counterstory is credible: better performance and power efficiency can lower the server and energy required for a given job. PM1763’s efficiency claim points in that direction. Yet Jevons-style rebound is possible if usage grows faster than cost per task falls.
The right question for a small team is not whether to use AI. It is which workloads convert added usage into revenue, support hours saved, or better conversion. Supplier earnings say the window for postponing that measurement is closing.
Second-order effects small teams may feel first
Cloud commitments
Compare discounts and exit costs against the full GPU, memory, storage, and network bill.
SaaS pricing
Unlimited AI can hide a steep cost curve; define usage bands, fair-use limits, and overages early.
Architecture
Smaller models, caching, batching, context compression, and retention limits become margin controls.
Investing
Do not map consolidated guidance to one division; wait for divisional profit, inventory, capex, and customer concentration.
Risks and counterarguments
Guidance contains no divisional explanation. FX, one-offs, and product mix may matter, so memory cannot explain the entire change.
Exceptional profitability invites supply. Faster capacity additions and competition could normalize memory pricing sooner than expected.
Efficiency gains can reduce total cost of ownership. Each team still has to test whether savings exceed usage growth in its own workload.
Quarterly operating checklist
✓ Calculate model, memory, vector database, storage, and network cost per 1,000 AI requests.
✓ Separate free and paid usage, then measure how much cost the top 1% of users creates.
✓ Set guardrails for context length, cache TTL, log retention, and image resolution.
✓ Stress-test annual cloud commitments under base, hypergrowth, and demand-drop scenarios.
✓ At Samsung’s full results, check divisional profit, memory inventory, ASP and shipment direction, and capex plans.
This article provides economic and company context for informational purposes only and is not financial advice. Make investment decisions independently based on your objectives, horizon, and risk tolerance.