
U.S. output rose 0.1%, but factories ran at 76.1%: the empty space between AI capex and broad demand
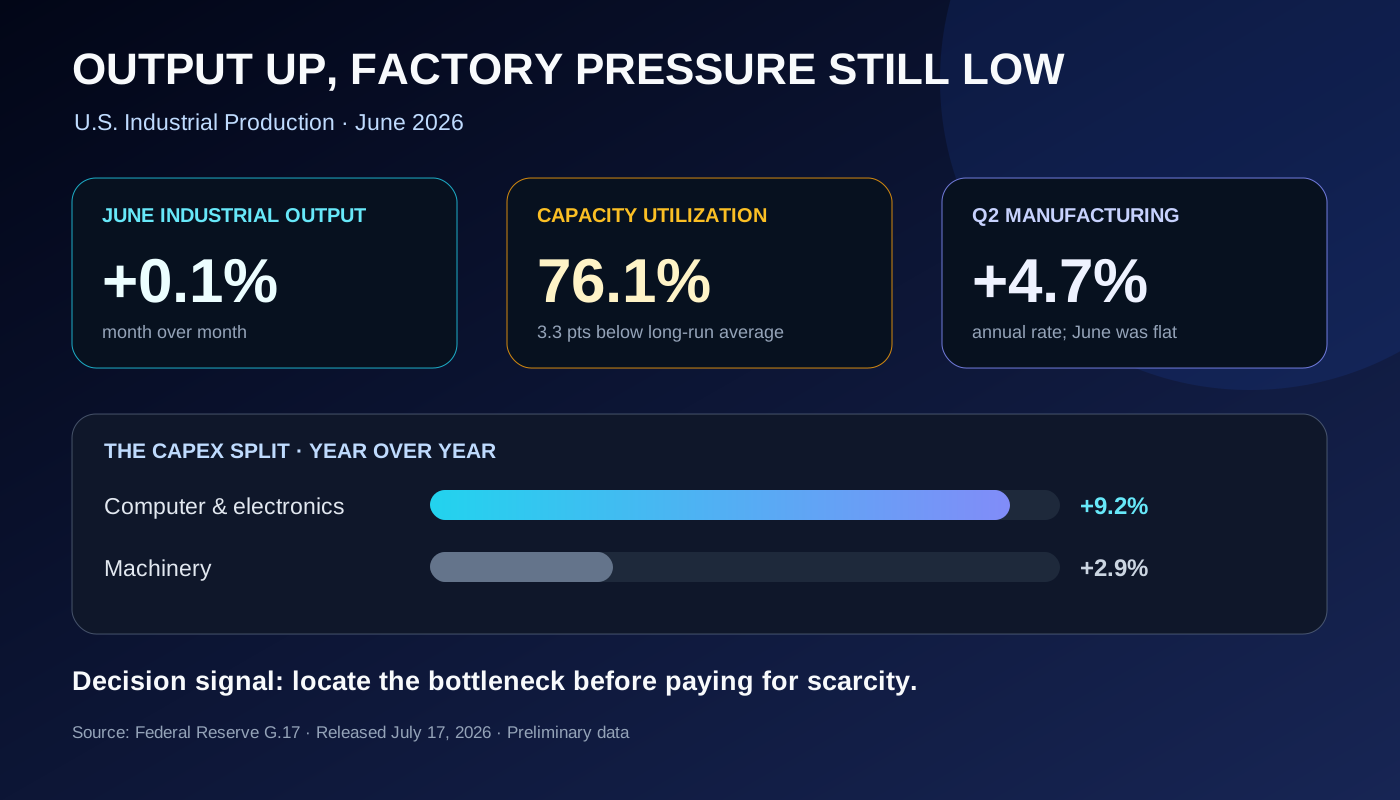
“Manufacturing grew at a 4.7% annual rate in the second quarter” sounds like a factory boom. The same Federal Reserve release says manufacturing output was flat in June and total-industry capacity utilization was only 76.1%, 3.3 percentage points below its long-run average. Output recovered, but scarcity has not spread across the industrial system.
That gap matters beyond macro forecasting. It affects how a small buyer negotiates lead times and minimum orders, how a vertical-software company segments manufacturing customers, and how an investor separates the beneficiaries of AI infrastructure from suppliers merely grouped under the same capex narrative.
Confirmed facts first
The Federal Reserve reported on July 17 that industrial production edged up 0.1% in June and expanded at a 4.0% annual rate in the second quarter. The June index stood at 102.6% of its 2017 average and was 1.1% higher than a year earlier. Manufacturing was unchanged for the month but grew at a 4.7% annual rate in Q2.
Total capacity utilization held at 76.1%, versus a 1972–2025 average of 79.4%. Manufacturing utilization slipped to 75.7%, 2.5 points below its long-run average. Mining was different: its 87.4% operating rate was 2.2 points above average. A single national utilization number therefore hides important sector pressure.
The market groups also split. Consumer-goods output increased 0.3% in June but remained 1.2% below a year earlier. Business-equipment output fell 0.4% for the month while staying 5.4% above a year earlier. Information-processing equipment was down 0.2% month over month and up 8.2% year over year; industrial and other equipment fell 1.0% in June and was only 1.0% higher over the year.
Computer and electronic-product output rose 0.1% in June and 9.2% from a year earlier. Machinery fell 0.7% in June and rose 2.9% over the year, while electrical equipment, appliances, and components declined 0.6% for the month. High-tech strength has not translated evenly into every equipment category.
Interpretation: recovery is not the same as scarcity
The decision-useful combination is positive output with below-average utilization. When spare capacity remains available, suppliers may have less power to impose broad price increases or long lead times. Buyers can test improved quote validity, lower minimum-order quantities, delivery guarantees, or cancellation rights instead of rushing into long commitments. That logic will not apply in pockets such as mining or constrained data-center inputs.
Do not mix time horizons. A 4.7% Q2 annual rate extrapolates the latest quarter; it does not mean manufacturing output rose 4.7% over twelve months. Put it beside flat June output and the 1.1% year-over-year manufacturing gain. The coherent reading is a fast quarterly rebound that lost momentum at the end of the quarter, not an economy-wide factory shortage.
| Signal | Reading | Decision meaning |
|---|---|---|
| June industrial output | +0.1% MoM | Positive direction |
| Total utilization | 76.1% | 3.3 pts below long-run average |
| Q2 manufacturing | +4.7% annual rate | June was flat |
| Computers & electronics / machinery | +9.2% / +2.9% YoY | Capex remains selective |
Market narrative: is the AI factory boom broad?
Markets can reasonably point to the year-over-year gains in computers, electronics, and information-processing equipment as evidence of an AI infrastructure cycle. The mistake is extending that evidence to all industrial demand. June declines in business equipment and industrial machinery, plus below-average manufacturing utilization, suggest a narrow and selective capex upswing. The useful question is not whether the AI boom is real, but where it is concentrated and which suppliers can convert it into orders and pricing power.
Second-order effects for suppliers, inventory, and labor
First, contract terms may improve before sticker prices fall in supply chains with slack. Second, the gap between advanced electronics and general machinery can widen revenue dispersion for logistics, industrial SaaS, recruiting, and maintenance vendors. Third, average spare capacity may delay broad expansion while bottlenecks in power, networking, cooling, or specific components still attract intense local capex. Fourth, hiring can lag production, so teams should not assume automation spending and broad headcount growth will accelerate together.
Operationally, test tightness by product, region, and process. If a quote rises, separate true capacity scarcity from materials, tariffs, freight, energy, and currency. Each cause calls for a different hedge or negotiation lever.
Action checklist for small teams and investors
Break the top ten supplier quotes into price, minimum order, lead time, and cancellation terms.
Do not apply AI/electronics growth rates to general industrial customers.
Recalculate capex break-even points under both 70% and 80% utilization scenarios.
Allocate inventory by substitute availability and reorder time, not headline volume.
Treat June as preliminary until July data and the Federal Reserve’s autumn annual revision.
Risks and counterarguments
Below-average utilization is not a recession call. Q2 growth was strong, and business equipment plus computers and electronics remained above year-ago levels. Nor does spare capacity guarantee stable prices: energy, tariffs, specialized components, and grid constraints can raise quotes outside the utilization measure. June is preliminary, and the Federal Reserve plans an autumn 2026 annual revision with a new 2022 base year. The conclusion is therefore not “industry is weak,” but “locate the bottleneck before acting on the aggregate.”
Disclaimer: This article is for information and economic interpretation only. It is not financial advice or an investment recommendation.