The uncomfortable signal in 6.5% U.S. PPI: watch supplier invoices before consumer prices
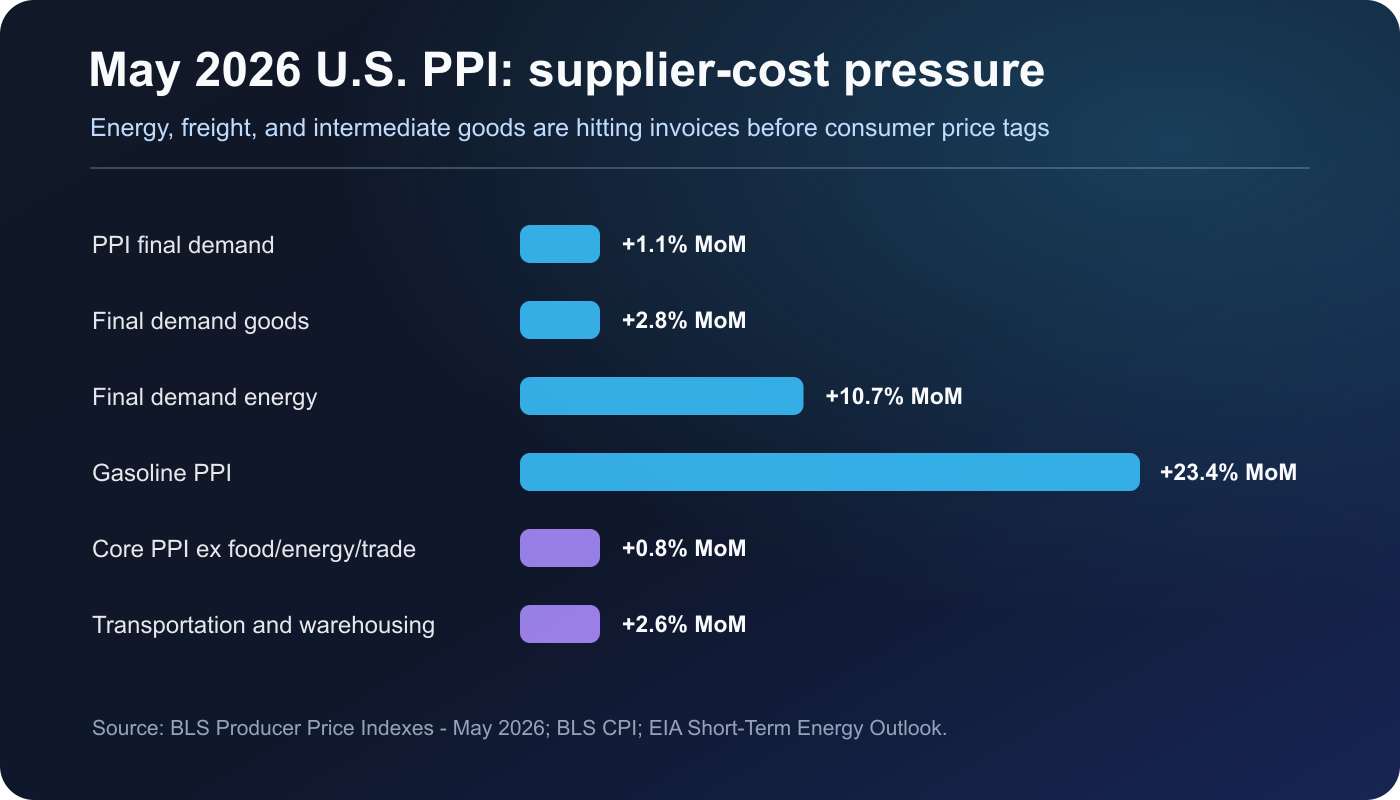
If CPI is the price tag households see, PPI is closer to the invoice businesses receive before those costs become visible. The May 2026 Producer Price Index, released by the Bureau of Labor Statistics on June 11, rose 1.1% month over month and 6.5% year over year for final demand. The annual rate was the largest since November 2022. For small teams, that is not just a macro headline. It is a prompt to reopen supplier contracts, logistics assumptions, cloud commitments, and pricing pages.
This is a different angle from the prior CPI shock. CPI tells us energy is already hitting consumers. PPI tells us where businesses may be absorbing costs before deciding whether to pass them on. That matters for SaaS founders, commerce operators, freelancers, and investors because the first casualty of a producer-price shock is often gross margin, not demand.
Confirmed Facts
- BLS reported that final demand PPI rose 1.1% in May after a 1.1% increase in April and a 0.7% increase in March.
- Final demand prices were up 6.5% from a year earlier, the largest 12-month increase since a 7.4% rise in November 2022.
- Almost 80% of the May increase came from a 2.8% rise in final demand goods. BLS said that was the largest goods increase since the series began in December 2009.
- Within goods, final demand energy jumped 10.7%. Gasoline PPI rose 23.4% and accounted for more than half of the goods advance.
- Final demand excluding foods, energy, and trade services rose 0.8% in May and 5.1% over 12 months, meaning the pressure was not only a gasoline story.
- Intermediate costs also moved sharply: processed goods for intermediate demand rose 3.5% in May and 13.3% year over year, while unprocessed goods rose 4.9% in May and 22.2% year over year.
- The CPI report released a day earlier showed consumer prices up 0.5% month over month and 4.2% year over year, with energy up 3.9% on the month and 23.5% over the year.
- EIA said the de facto closure of the Strait of Hormuz had lasted more than three months, Brent averaged $107 per barrel in May, and Brent was forecast around $105 per barrel in June and July.
| Indicator | Move | Signal |
|---|---|---|
| PPI final demand | +1.1% MoM | +6.5% YoY |
| Final demand goods | +2.8% MoM | largest since Dec. 2009 series start |
| Final demand energy | +10.7% MoM | 80% of goods advance |
| Gasoline PPI | +23.4% MoM | over half of goods advance |
| Core PPI ex food/energy/trade | +0.8% MoM | +5.1% YoY |
| Transportation and warehousing | +2.6% MoM | freight pass-through risk |
| Processed intermediate goods | +3.5% MoM | +13.3% YoY |
| Unprocessed intermediate goods | +4.9% MoM | +22.2% YoY |
Why It Matters
PPI does not mechanically become CPI. Some firms hedge, some have fixed contracts, and some cannot raise prices without losing customers. That is exactly why the signal is important: if input costs keep rising while customer prices lag, the pressure shows up first in margins, payment terms, discounting, and renewal negotiations.
The detail matters. Transportation and warehousing services rose 2.6% in May. Processed energy goods and crude petroleum pushed intermediate demand higher. Those categories touch cross-border commerce, hardware procurement, business travel, data-center expansion, and even software infrastructure. Cloud providers and AI platforms may not change list prices immediately, but power, cooling, networking, equipment delivery, and financing costs eventually shape credits, committed-use discounts, regional pricing, and premium tiers.
Market Narrative Signals
The market question is shifting from “Will the Fed cut soon?” to “How long do high short rates and energy costs stay embedded in operating plans?” The next FOMC meeting is scheduled for June 16-17, 2026. April FOMC minutes had already noted that Middle East conflict and energy prices pushed up near-term inflation compensation and policy-rate expectations. Tools such as the Atlanta Fed Market Probability Tracker matter because traders are pricing the duration of restrictive conditions, not just the next meeting.
In builder communities, the practical questions are less abstract: Should annual SaaS discounts shrink? Should dollar-denominated vendor costs be hedged with more cash buffer? Can shipping surcharges be itemized? Will customers accept usage-based pricing if the cost driver is transparent? The PPI report gives operators a credible reason to have those conversations before margins are already damaged.
Second-Order Effects
- Delayed pass-through: fuel surcharges, freight, materials, and payment costs often hit B2B invoices before consumer prices.
- Margin compression: teams that cannot raise prices absorb the hit; teams that do raise prices face conversion and retention risk.
- Slower easing hopes: when CPI and PPI both point to energy pressure, the Fed has less room to sound relaxed.
- Dollar-cost sensitivity: Korean and other non-U.S. operators can feel a double hit from dollar vendors and energy-linked FX pressure.
- AI infrastructure costs: power, cooling, hardware delivery, and network equipment are hidden inputs behind token and API prices.
Checklist for Small Teams and Investors
• Separate fuel, freight, payment, cloud, and AI inference costs in this month’s vendor review.
• Tie price changes to the cost driver: usage tiers, faster delivery, premium support, overseas payments, or high-SLA workloads.
• Run a 12-month downside case with no rate cuts, higher energy costs, and a 5-10% unfavorable FX move.
• For public companies, look beyond revenue growth: pricing power, gross margin defense, inventory, freight exposure, and dollar debt matter more now.
• For AI products, monitor cache hit rates, model routing, region choice, and network egress alongside headline token prices.
Risks and Counterarguments
The obvious counterargument is volatility. Energy-driven PPI spikes can reverse if oil flows normalize and inventories rebuild. Trade margins also fell in May, which means not every intermediary has pricing power. If demand softens, many businesses may eat the cost rather than pass it to customers.
Still, operating plans cannot rely on a perfect reversal. A better response is to decompose cost drivers, test pricing sensitivity early, prepare customer-facing explanations, and keep enough liquidity for a longer period of sticky rates and supplier-cost pressure.
Disclaimer
This article is for economic and market context only. It is not a recommendation to buy or sell any asset and is not financial advice.
Sources
- BLS: Producer Price Indexes - May 2026
- BLS: Consumer Price Index Summary - May 2026
- EIA: Short-Term Energy Outlook, Global oil markets
- EIA: Short-Term Energy Outlook, U.S. petroleum product prices
- Federal Reserve: 2026 FOMC meeting calendar
- Federal Reserve: April 28-29, 2026 FOMC minutes
- Atlanta Fed: Market Probability Tracker methodology