
US September housing starts fell 5.2%: read the interval and annualized pace
Should a lower housing-starts headline immediately reduce next year’s revenue plan? Census Bureau and HUD data released October 20, 2026 put September privately owned housing starts at a seasonally adjusted annual rate of 1.221 million, down 5.2% from August’s revised 1.288 million pace. The release also attaches a sampling interval of ±11.8 percentage points and an asterisk. Keeping the estimate and its uncertainty together prevents a business conclusion from becoming stronger than the evidence. The task is to decide what to investigate, not to manufacture a precise company forecast from a national headline.
The annualized pace is not the number built in September
SAAR means seasonally adjusted annual rate. It expresses a month’s adjusted pace on an annual basis, rather than the actual number of starts during September or a guaranteed full-year result. The monthly comparison also uses a revised August estimate. If an earlier August value is in your notes, preserve that vintage and separately record the revised comparison base. Mixing actual monthly counts, annualized rates and different release vintages in one budget worksheet can produce a misleading change even when each copied number was accurate in its original setting.
A negative estimate is not a statistically established direction
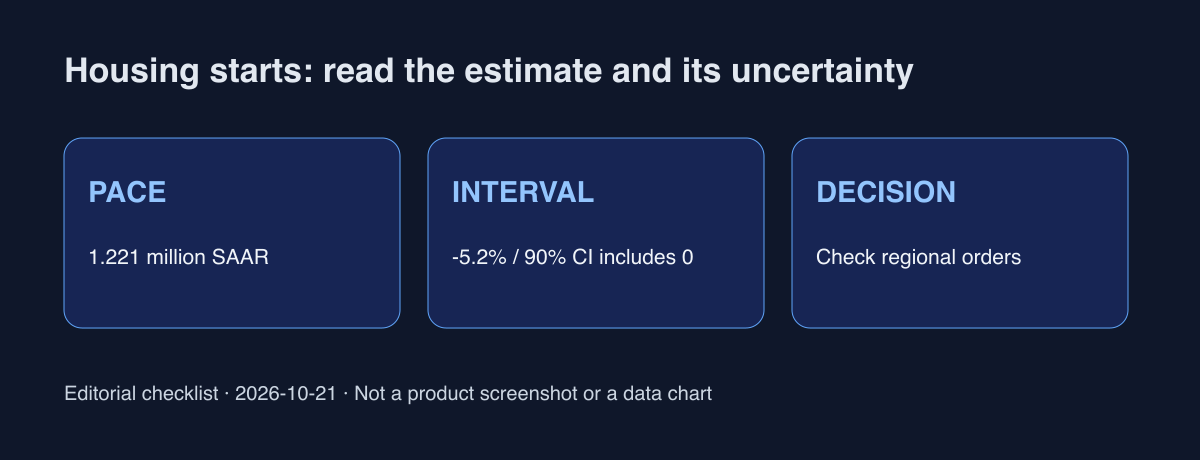
Applying the release’s ±11.8-point interval to -5.2% gives -17.0% to +6.6%. Because it includes zero, the release’s explanation says there is insufficient statistical evidence to establish an increase or decrease. That does not prove the actual change was zero, nor that housing conditions are healthy. The interval addresses sampling variability, not every possible source of error. A useful note therefore retains both the negative estimate and the lack of statistical significance instead of converting either fact into certainty about the entire market.
Permits, starts and completions run on different clocks
The same report lists total permits at 1.400 million SAAR and completions at 1.192 million SAAR. These are not three stages of the same homes passing through a single monthly conversion funnel. Projects begun at different times are mixed together. A supplier selling into early construction and a service provider selling after move-in need different operational comparisons. The accompanying diagram proposes a reading sequence; it is not a demand model, a product screenshot or a forecast of future housing activity.
Connect the national question to your own orders
As a proposed operating practice, record customer geography, single-family versus multifamily exposure, the construction stage that triggers an order, actual purchases and cancellations, and the lag from contract to recognized revenue. A lower national starts estimate can prompt an investigation, but it supplies no automatic coefficient for your sales. Stable orders may come from older projects rather than fresh activity. Falling orders may also involve prices, inventory decisions or customer concentration. Check those alternatives instead of assigning every company result to interest rates or extrapolating one headline into a hiring decision.
The monthly direction drawing attention in market discussion is a starting question. The official notes say establishing an underlying trend in total starts may take six months; that is not a prediction of recovery after six months. The next release is scheduled for November 18. Recheck revisions and intervals then. If a budget must change sooner, record the owner, company-order evidence and review date. The decision will remain auditable when the national estimate is revised or the local pipeline behaves differently.
Official sources and interpretation
Census / HUD · September 2026 release
Checked October 21, 2026. Informational economic context, not investment advice. Bring the housing estimate and the stage that triggers your own orders to the next budget review.