
US annual spending reached $81,905; housing took 45% of the increase
Average annual US spending rose to $81,905 in 2025. Behind that headline, one item stands out before shopping or travel: housing. In the Consumer Expenditure Surveys released by the Bureau of Labor Statistics on October 29, housing averaged $27,790, or 33.9% of total expenditure. Looking at where the extra dollars went changes the story told by a single spending-growth number.
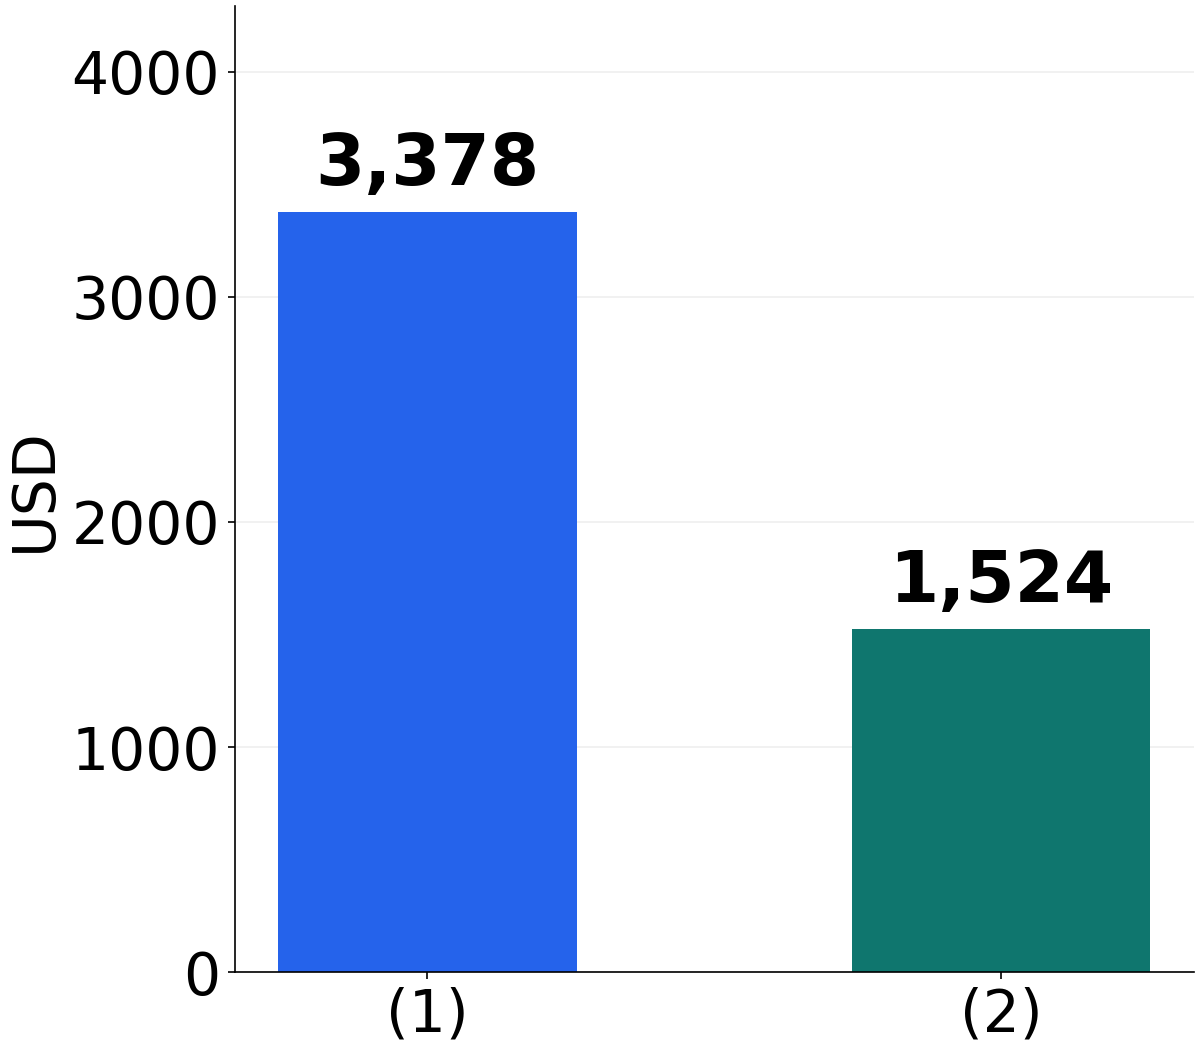
Total spending rose $3,378, including $1,524 for housing
The release puts average annual expenditure at $78,527 in 2024 and $81,905 in 2025: a $3,378 increase, or 4.3%. Housing in the same table rose from $26,266 to $27,790, an increase of $1,524. Dividing the housing increase by the total increase gives approximately 45.1%. Nearly half the rise in the published average amounts was associated with housing.
That 45.1% is our calculation from differences between two annual averages. It does not track the destination of each additional dollar spent by the same households. It is still a useful way to see the composition behind the headline. In the first chart, housing is part of the total increase: the bars overlap conceptually and must not be added together.
Housing is a broader category than the rent bill
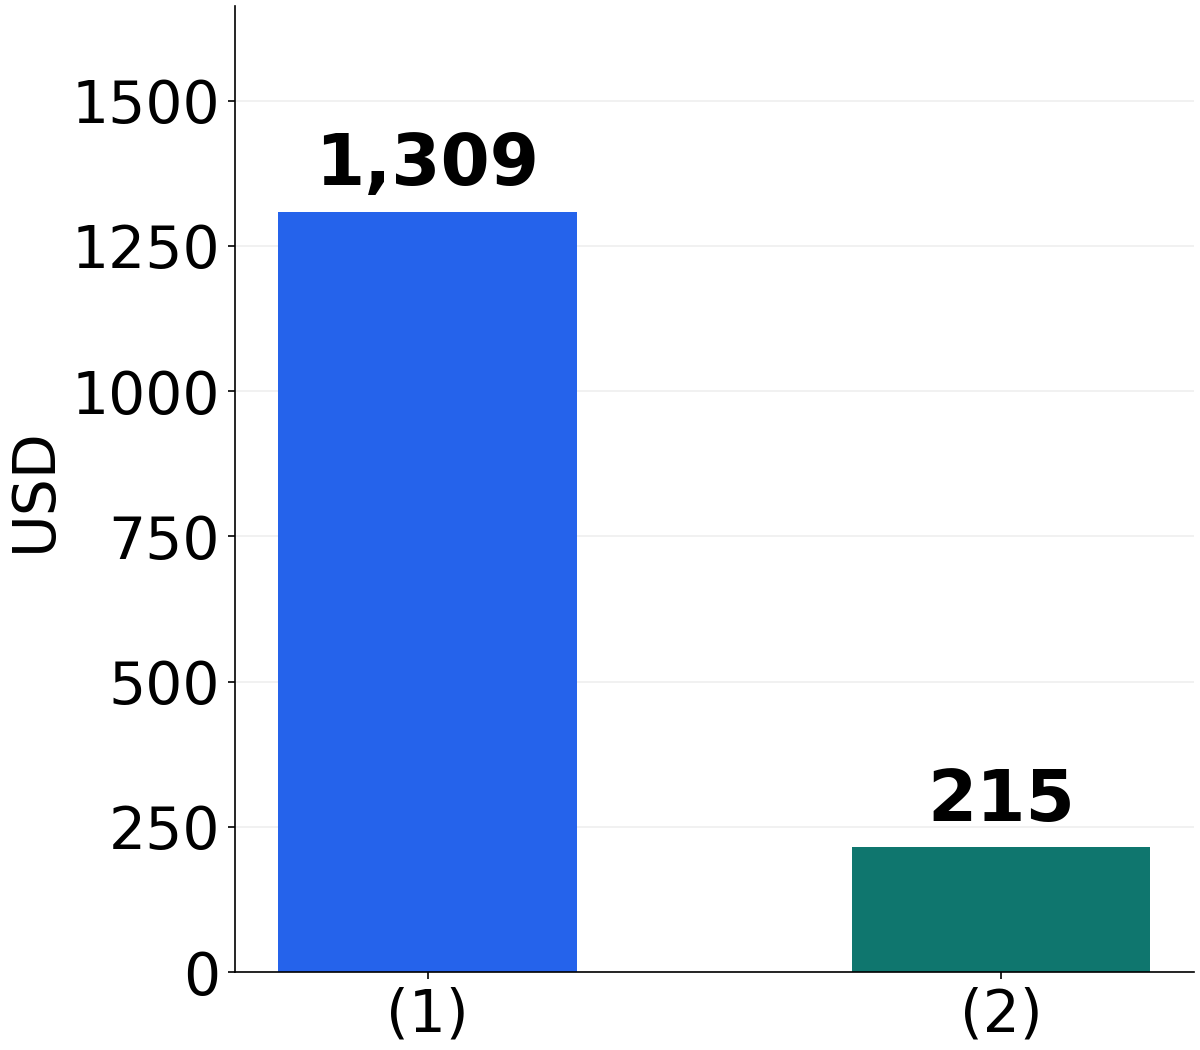
BLS housing expenditure includes shelter, utilities, household operations, supplies, and furnishings and equipment. Within it, shelter rose from $16,317 to $17,626, an increase of $1,309. That represents approximately 85.9% of the $1,524 housing increase. The combined increase in all remaining housing components was $215. This decomposition helps explain why the broader category moved.
The owned-dwellings category includes mortgage interest, property taxes, insurance, and repairs, but mortgage principal repayments are outside this expenditure category. So a 5.8% rise in housing spending does not establish that every home price or rent rose 5.8%. The second chart divides the housing increase into shelter and the remaining components; unlike the first chart, these two bars add to the $1,524 total.
Spending growth and inflation answer different questions
The release reports annual CPI-U inflation of 2.6% for 2025. Expenditure surveys measure how much consumer units spent; a price index measures price changes. Spending also reflects quantities and the mix of purchases. Subtracting 2.6% from 4.3% therefore does not produce an official measure of real consumption growth. The two statistics illuminate different parts of the household economy. That annual CPI-U average uses 11 months because October 2025 data are unavailable.
The unit is also different from one person’s card statement. A consumer unit can be a family, a financially independent individual, or people living together who share major expenses. The $81,905 average neither says everyone spent that amount nor identifies the most common household budget. Different compositions and income levels can sit behind the same overall average, so matching a personal budget to that number alone would miss important context.
What the annual household ledger reveals
This release also carries a collection gap. During the 2025 lapse in federal appropriations, the surveys could not be collected in October and November. BLS adjusted weights to account for missing data; collection resumed on December 5. The published annual estimates and the absence of collection in those months should be understood together when interpreting the results.
Higher expenditure does not automatically describe more discretionary comfort. In these average amounts, housing—and shelter within it—accounted for a large share of the increase. Reading the destination of extra spending alongside its total brings us closer to the everyday choices behind the data. This article provides economic information and is not investment advice.
Sources and calculation basis
BLS · Consumer Expenditures 2025 · 2026-10-29