
Tonight's US trade release: separate goods and services before reading the deficit
If the US trade deficit widens, should a small Korean software team immediately lower its revenue outlook? A total alone cannot support that conclusion. Turning a combined goods-and-services number straight into product demand or a currency forecast mixes questions that need different evidence.
The BEA and Census schedules checked on the Korean morning of October 6, 2026 list August trade data for 08:30 ET that day, equivalent to 21:30 KST. This is a reading plan written before the release, not commentary claiming to know the August result. Recheck the official schedule if it changes.
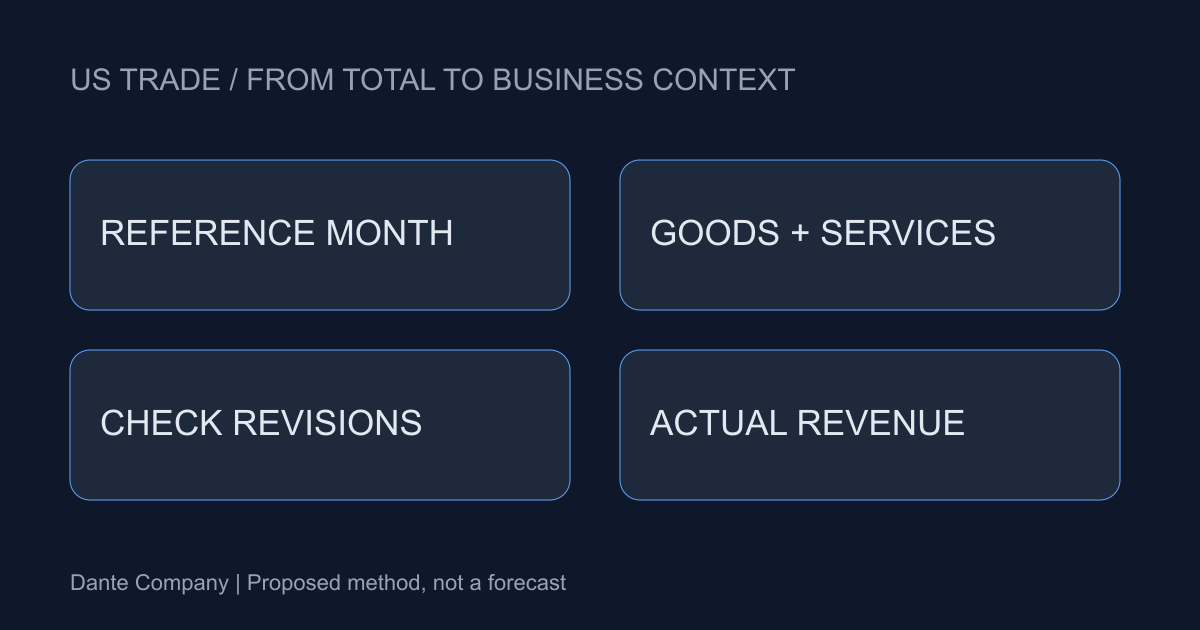
Separate the release month from the data month
The October 6 release concerns August. It is not a real-time measurement of today's economic conditions. Write down the publication date and observation period separately so that an event in the current news is not automatically assigned as the cause of a number collected earlier.
The preceding result currently shown by BEA is a July goods-and-services deficit of $88.6 billion, up from a revised $71.2 billion in June. Those are not August figures. After publication, check both the new month and any revision to earlier values so that your comparison keeps a consistent baseline.
Read goods and services inside the total
The preceding July explanation lists a goods deficit of $119.6 billion alongside a services surplus of $31.0 billion. Combining the two in the same units yields the total deficit of $88.6 billion. The example shows why the single word deficit can conceal sectors moving in different ways.
The next question is not simply whether the balance improved or worsened, but which exports or imports and which component changed. A smaller deficit caused only by lower imports can carry a different business implication from stronger services exports. This is an interpretation example, not a prediction about the forthcoming month.
Services statistics are not your team's sales
BEA describes trade between US residents and residents of other countries. The table does not directly measure an individual app's conversion rate or a Korean SaaS company's US customer count. An aggregate movement in services should not be treated as an equal movement in demand for your particular product.
For a team, it is useful to review US customer payments, cancellations, refunds, billing currencies, settlement dates and actual receipts separately. Even unchanged sales can produce different won receipts because of currency and settlement conditions. If you connect a macro series with the revenue ledger, be able to explain the link rather than relying on a shared label.
Record three layers after publication
The first layer is verified facts: reference month, release date, total exports, imports and balance, the goods/services split and prior-period revisions, preserved with the source tables. In a second layer, state which component matters to your question and why. Keep that interpretation visibly separate from the published facts.
The third layer is the internal evidence required before action: US customer renewals, refund reasons or cash flow by currency, for example. Instead of changing pricing and hiring together immediately after a release, define which evidence would change a specific decision. That makes the next review more useful than a general reaction to the headline.
Do not use the balance as a currency formula
It is understandable to watch the release as a market event, but one month's trade balance is not a single-direction signal for exchange rates or interest rates. Expectations, financial flows and other policies or indicators can also matter. This article does not forecast a currency level or a market response.
Tonight's objective is to read the period, composition, revisions and business connection before reacting to one number. Confirm the official release, compare internal evidence and review only the decisions it actually informs. This article provides information and is not financial or investment advice.