
After the August U.S. trade release: compare nominal and real data within the same scope
A headline about a wider U.S. trade deficit is not enough to rewrite next quarter’s order quantities or unit-cost assumptions. A larger dollar transaction value and a larger price-adjusted trade volume answer different questions. Yesterday’s August release is useful if we first align scope, units and release version. The starting point is not a market prediction; it is knowing whether the figures in our comparison describe the same statistical object.
The release date and the period measured
BEA and Census released August 2026 goods-and-services trade data on October 6. Exports were $315.2 billion, imports $420.8 billion and the deficit $105.6 billion. July’s $92.8 billion deficit is revised. These figures describe August transactions, not live October orders or prices.
The release says its headline totals are seasonally adjusted but not adjusted for price changes. Becoming available now does not make the observations contemporaneous with a business’s current situation. In a small team’s cost notes, keep August as the reference month and October 7 as the checking date. The gap between release time and transaction time is a property of the statistics, not evidence that the release is defective.
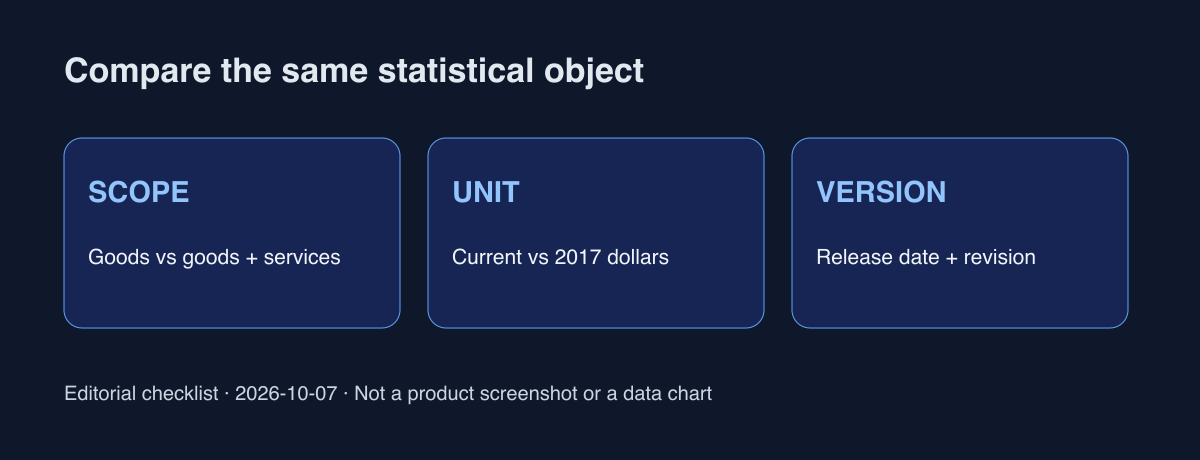
What do 5.4% and 4.1% compare?
In the release’s discussion of exhibit 11, Census-basis goods imports rose 5.4% month over month in nominal terms and 4.1% in real 2017 dollars. This comparison uses the same goods scope with different dollar measures. Do not compare growth in the total goods-and-services deficit with real goods-import growth and label the difference a price effect.
The comparison shows why dollar flows and price-adjusted scale can differ. Subtracting 4.1 from 5.4 does not yield your company’s tariff rate or a supplier’s price increase. Aggregate scope, index construction and product mix differ from your purchasing basket. Before copying a number into a cost sheet, label the question it is actually capable of answering.
Build a table with matching scope, units and version
A small operating table can record item, goods-only or goods-and-services scope, statistical basis, nominal or real measure, reference month and release version. Check that the objects match before reading growth rates. When revisions arrive, retain the old file and log the new version and changed cells. This is our proposal for a team record, not a new capability announced by the statistical agencies.
For an imported-equipment budget, keep national goods-import growth in a background row. In the decision row, separately list a supplier quote’s item, quantity, currency, freight, taxes and payment date. A rise in an aggregate nominal total does not mean one machine’s price increased by the same percentage. The purpose is to preserve the distinction between what those two rows measure.
Separate unit-cost and purchase-quantity questions
The following is a conditional example. A business can spend more dollars because it buys more equipment, or because the same equipment costs more. The first case may call for utilization and payback analysis; the second for alternative quotes and contract review. Exchange rates and payment timing can change cash outflows again. One national statistic cannot determine which mechanism applies to a particular company.
A public market-forum post asks whether a wider trade deficit necessarily signals weaker demand. That is an example of a question attracting attention, not proof of market-wide agreement or a cause of price moves. We do not repeat that discussion’s market levels or return claims. This article focuses on scope and units verified in the official release.
Avoid fixing a decision to one monthly observation
There is a counterargument: excessive breakdowns can delay a practical decision. Start with one purchase item that materially affects costs and distinguish the macro background from the supplier evidence. National data may be useful context, but it cannot replace orders, inventory or quotes. Real trade measures are not direct counts of the units sold by an individual company either.
BEA lists November 4 as the next release date for September trade. The useful follow-up is to compare the revised prior month and new reference month on matching bases, not to guess the direction in advance. Keep today’s cost assumptions alongside quote and contract evidence, and state which new information would trigger a review. This article is informational and is not personalized financial advice.
Sources and verification scope
BEA · International trade data
Market forum · discussion signal only
Official release checked October 7, 2026. Figures retain their published scope and units; the cost table and conditional examples are our operating proposals. Start by labeling the comparison basis for one purchase item.