
US spending rose 0.5%, but people bought little more in real terms
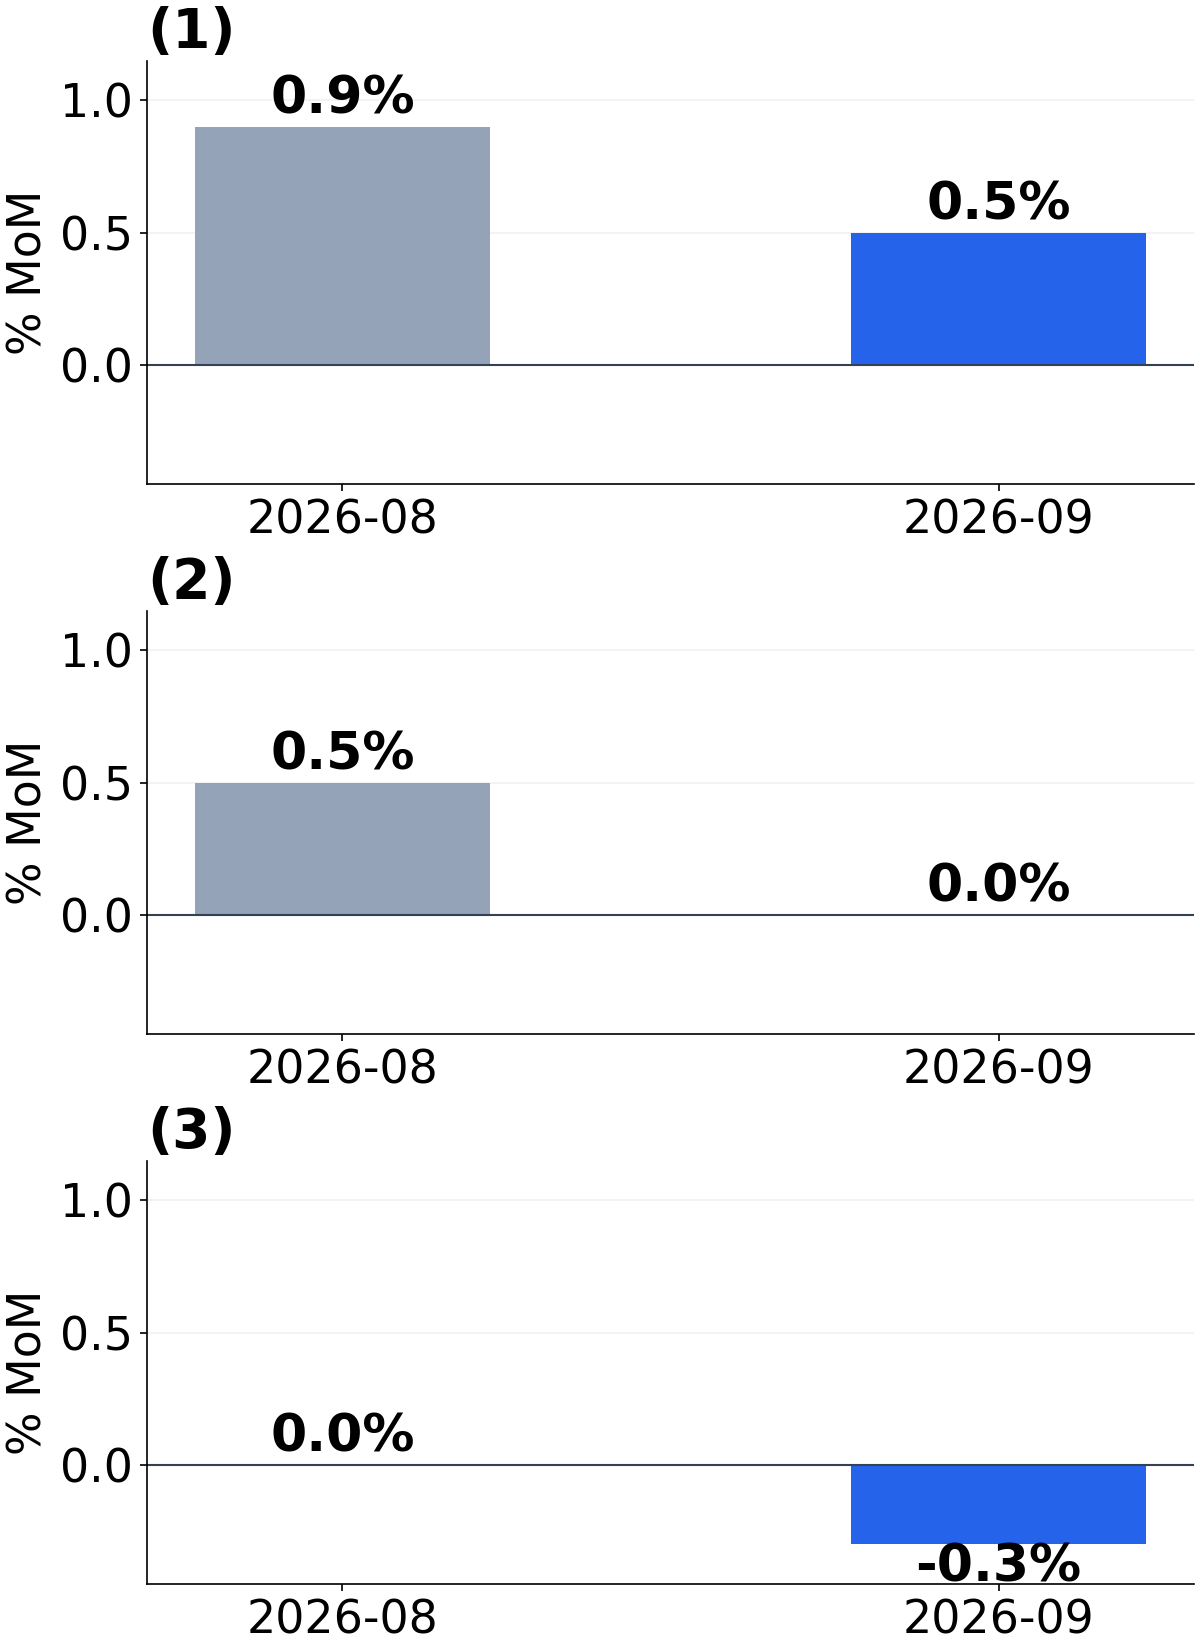
A larger payment does not necessarily mean a larger shopping basket. BEA's September personal income and outlays release, published October 29, offers a clear example. Consumer spending rose 0.5% from August in current dollars, while inflation-adjusted consumption increased less than 0.1%. Households spent more dollars, but the aggregate volume of consumption barely increased.
Prices sit between dollar spending and consumption volume
Personal consumption expenditures cover goods and services bought by, or on behalf of, US residents. Nominal spending values transactions at current prices; real spending removes the effect of price changes. The PCE price index rose 0.5% in September. Read beside nominal spending growth, that helps explain why a higher dollar total is not evidence of a strong increase in the quantity consumed.
BEA's summary table rounds September real PCE growth to 0.0% at one decimal place. The text gives finer detail: a $2.6 billion increase, less than 0.1% at a monthly rate. It would be wrong to rewrite that as exactly zero growth or a decline. The first chart uses the table's rounding, and the caption explains how a small positive increase can display as 0.0%.
Income can rise while purchasing power falls
Personal income and disposable personal income each rose 0.2% from the previous month. Real disposable income fell 0.3%, however, as prices rose faster. The cash available after taxes and the amount that cash can buy are different measures. An increase in nominal income and a decline in purchasing power are therefore consistent, rather than contradictory, observations.
For an illustrative example, let after-tax income rise from 100 to 100.2 while the price of the same consumption bundle rises from 100 to 100.5. Income has increased, but the number of bundles it can buy falls by approximately 0.3%. This is not a replication of BEA's actual calculation; it simply makes the direction intuitive. Reading income and prices together reveals pressure that a nominal income headline can hide.
Services accounted for more of the dollar increase
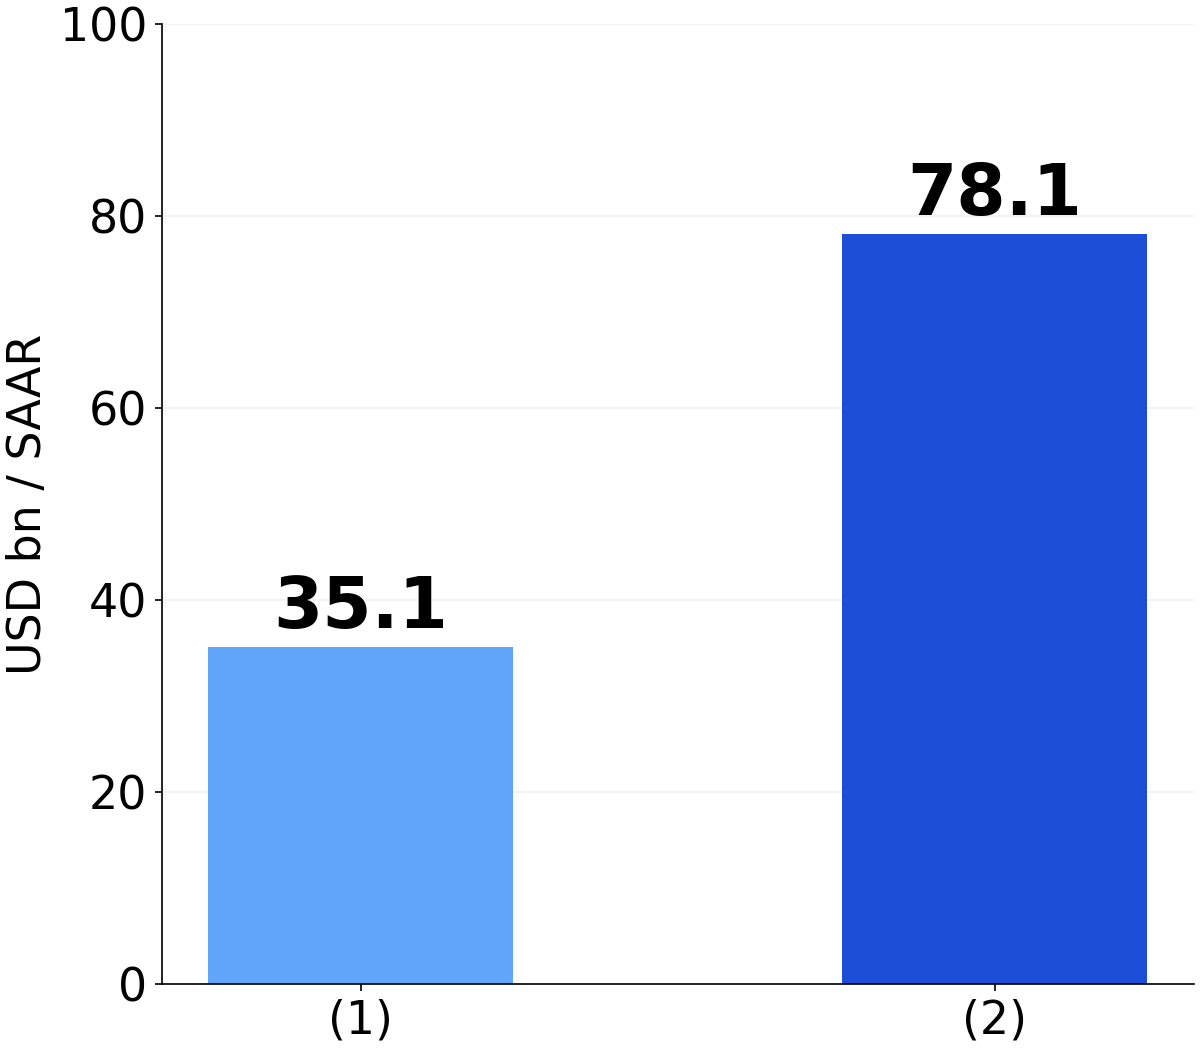
The current-dollar PCE increase was $113.1 billion, comprising $35.1 billion in goods and $78.1 billion in services. The components may not sum exactly to the total because of rounding. These dollar changes compare seasonally adjusted annual-rate levels. They should not be described as that many extra dollars actually paid out during September alone.
Services made the larger contribution to the nominal increase. That does not establish that service volumes grew faster than goods volumes or that sales strengthened in every industry. Current-dollar totals contain both price and quantity effects. The second chart compares increases in the same units rather than using a pie chart that could exaggerate the precision of their shares.
A 3.8% saving rate and the next release
Personal saving was 3.8% of disposable income. This aggregate ratio does not mean that every household saved 3.8% of its income. The income measure also does not simply add in capital gains from rising asset prices. The saving rate alone therefore cannot describe each household's financial cushion, wealth or distribution of resources.
PCE prices rose 3.6% from a year earlier, or 3.1% excluding food and energy; monthly increases were 0.5% and 0.3%. These periods differ from the quarterly annualized figures in the GDP release published the same day. September shows how rising dollar spending can coexist with weak real consumption and falling real after-tax income. The next release is November 25. Watch whether volumes and purchasing power recover together. This article provides economic information, not individual investment advice.