
US GDP grows 3.4%: why rising computer imports can accompany growth
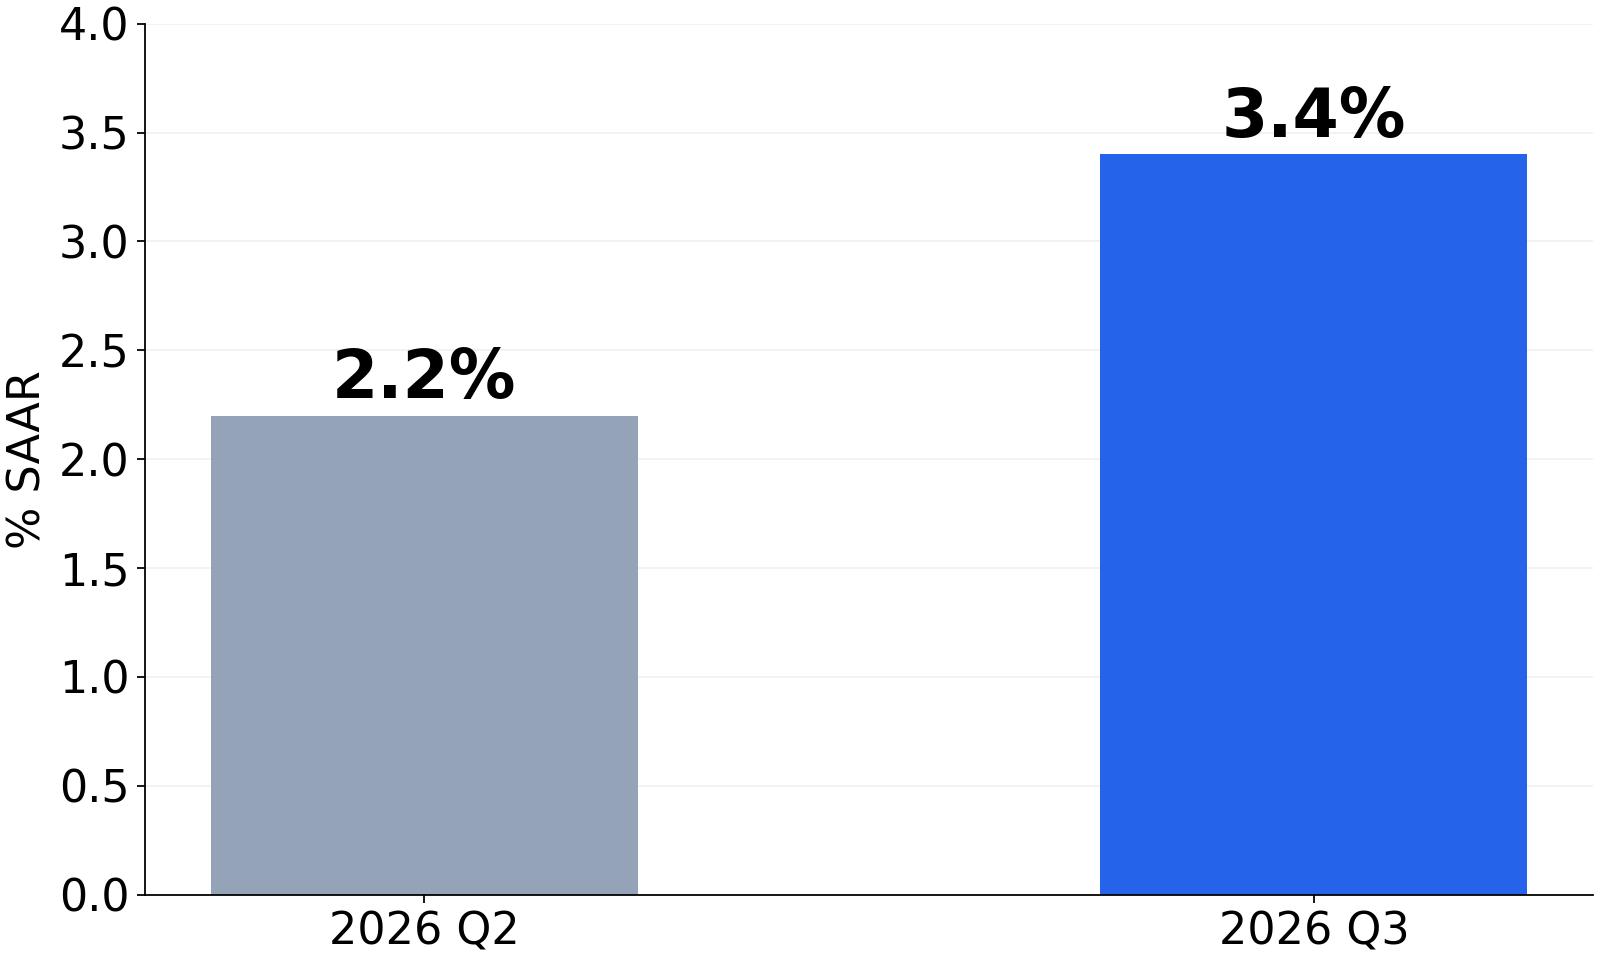
The US economy grew at a 3.4% annual rate in the third quarter, according to the BEA advance estimate released October 29, up from 2.2% in Q2. Computers and capital goods appear both in the investment story and in imports, which are subtracted from GDP. Why can equipment show up on both sides of that calculation?
3.4% is an annualized pace, not a three-month increase
This is inflation-adjusted GDP measured at a seasonally adjusted annual rate relative to the previous quarter. BEA also reports a 0.8% quarterly increase. The 3.4% headline expresses the pace as if it continued for four quarters; it should not be mistaken for the actual change achieved in those three months.
The move from 2.2% to 3.4% is 1.2 percentage points. BEA attributes the acceleration mainly to faster investment growth and an upturn in government spending, partly offset by exports turning down. Imports grew faster as well. The chart compares two quarterly real growth rates on the same annualized basis.
Buying computers and counting domestic production
Information processing equipment, mainly computers and peripheral equipment, led the rise in equipment investment. BEA cites trade statistics and September advance indicator data among its sources. Capital goods excluding automotive were the largest contributor to imports. Those descriptions alone do not establish that every computer purchase was an AI data center investment.
GDP counts value produced domestically. In a deliberately simplified example, a business buying 100 of foreign-produced equipment adds 100 to investment and subtracts 100 as imports, removing foreign production from domestic GDP. Actual transactions may also generate domestic distribution or installation value. Higher imports therefore do not, by themselves, establish weaker domestic demand.
Inventory accumulation differs from a final customer purchase
Private inventory investment also helped lift investment. Wholesale trade and manufacturing, especially nondurable goods industries, were prominent. Inventory investment reflects the change in inventories during the period rather than the accumulated stock itself. Distinguishing goods entering warehouses from goods sold to final customers clarifies what is driving production.
A separate measure combines consumption and gross private fixed investment, excluding inventories, net exports and government spending: real final sales to private domestic purchasers. It rose at a 4.9% annual rate after 4.6% in Q2. Beside GDP, it shows why the entire growth story cannot be reduced to inventories alone.
Growth accelerated while quarterly inflation slowed
The quarterly PCE price index rose at a 2.1% annual rate, down from 5.0%; excluding food and energy, the rate slowed to 2.5% from 3.3%. PCE* in the chart denotes that exclusion. These quarterly annualized rates should not be equated with year-over-year rates in the monthly September report.
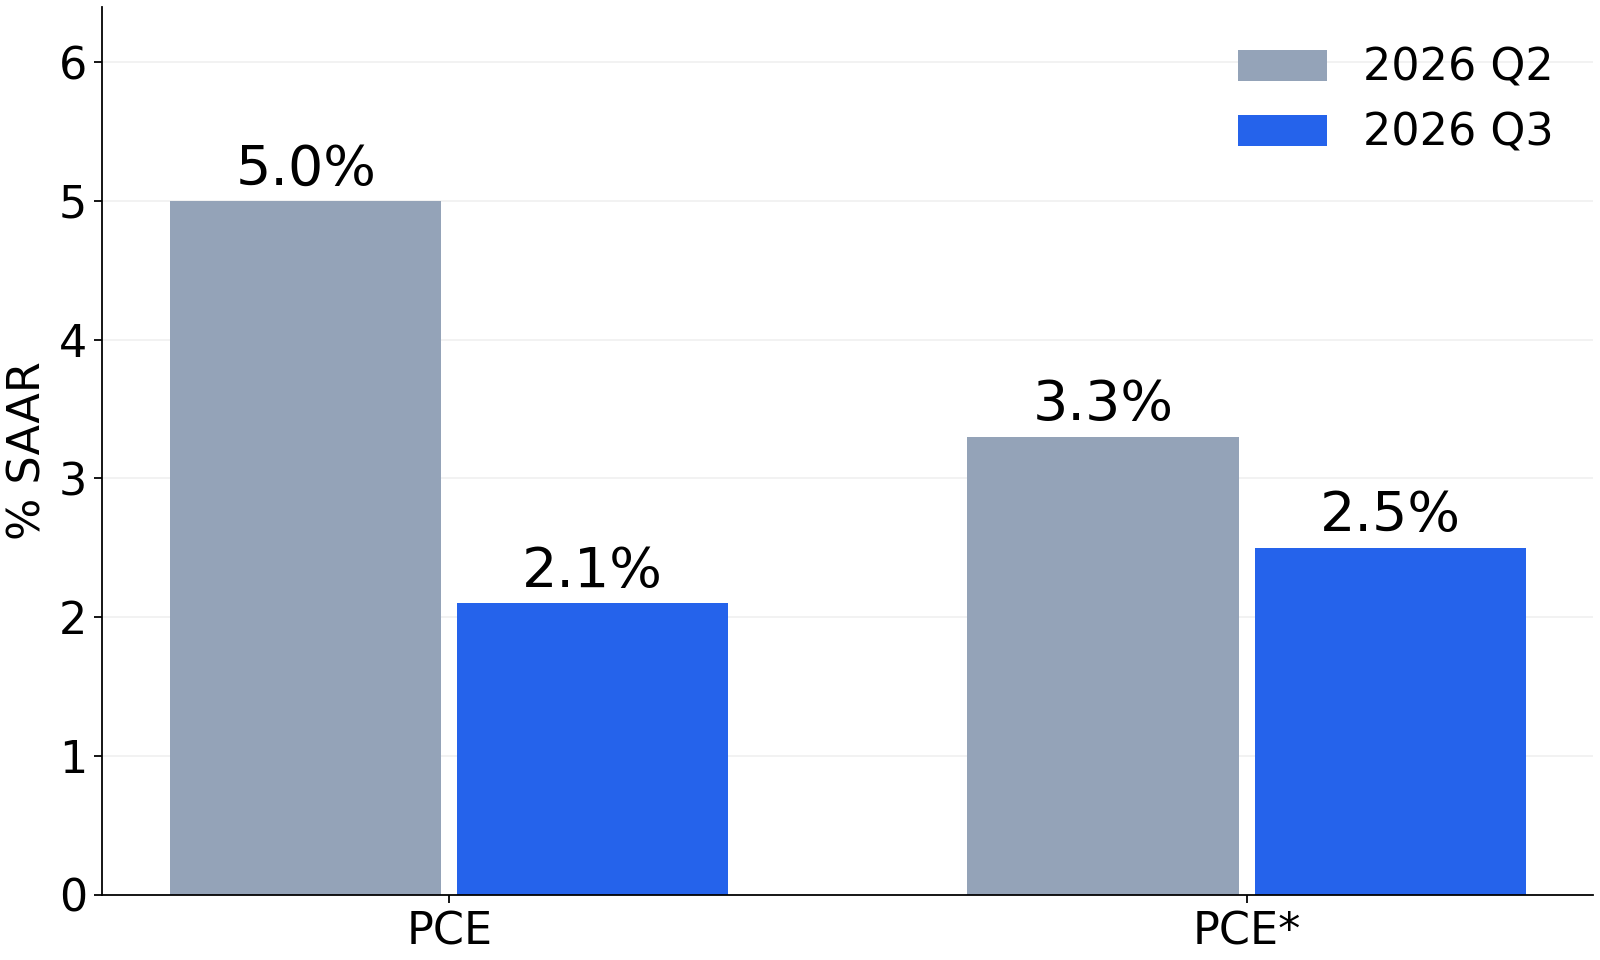
The release pairs faster output growth with slower quarterly price growth. The next estimate arrives November 25. Equipment, inventory composition and the persistence of final demand will help explain any revisions alongside the headline. This article provides economic information, not personal investment advice.