
September FOMC Raises Rates by 0.25 Percentage Points: A Cost Map for Small Teams to Unfold First
On the morning you see news that interest rates have risen, not every cost for a small team goes up on the same day or by the same amount. That is because the reset dates for loan rates, the settlement dates for dollar invoices, and the points at which customers make purchasing decisions are all different. Rather than bumping up costs across the board by a single number, this decision is an opportunity to recheck each respective path.
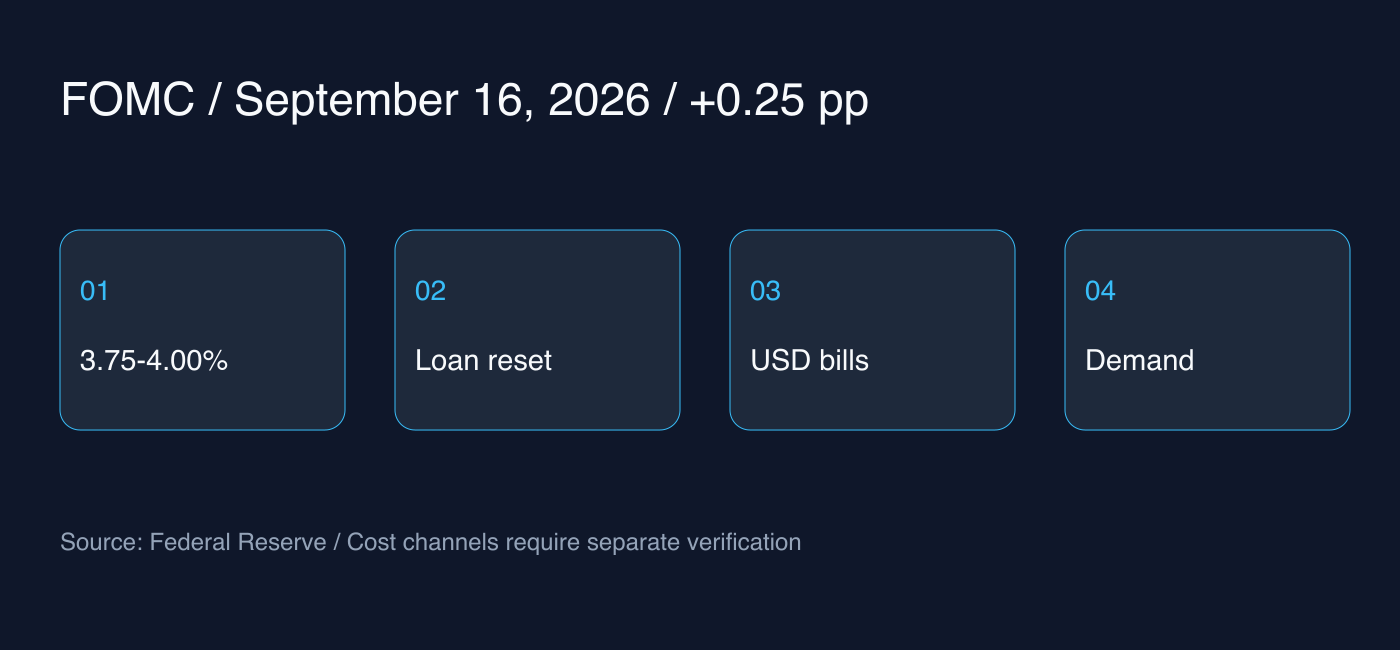
The US Federal Reserve announced the FOMC decision at 2:00 PM Eastern Time on September 16, 2026 (3:00 AM on September 17, Korea Standard Time). This article shares facts and operational interpretations based on official materials reviewed on the morning of September 17. It is not an analytical measurement of actual market pricing or exchange rate reactions.
Confirmed Decision: Target Range of 3.75–4.00%
The FOMC decided to raise the federal funds rate target range by 0.25 percentage points to 3.75–4.00%. The official statement was approved by a 12-to-0 vote and stated that it would continue its policy of maintaining ample reserves in the banking system. This refers to the US policy rate target range and does not mean Korea's base interest rate or the loan rates of individual companies.
The statement assessed that economic activity has been expanding at a solid pace and inflation remains elevated. Economic projection materials were also released on the same day. However, projections reflect each participant's expectations under their assumptions of appropriate monetary policy and should not be read as a contract guaranteeing the future path of interest rates.
The First Map: Loan Reset Dates
The following contents are operational check suggestions rather than predictions derived automatically from this decision. First, check the currency of loans or credit lines, whether they are fixed or floating, the benchmark rate and spread, and the next reset date. The fact that the policy rate moved may diverge from the timing when your actual interest bill changes.
If you have a fixed-rate agreement, you should first read the terms for the current active period. Even with floating rates, the effect varies depending on which index is reflected and when. A spreadsheet that adds 0.25 percentage points across all borrowings is simple to calculate, but it can overlook contractual structures.
Calculation Examples Are Only for Explaining Exposure
If an additional 0.25 percentage points per year is applied precisely to a hypothetical $100,000 balance, the simple annual interest increases by $250. This is an illustrative calculation multiplying only the principal and the rate change. It is not an estimate that accounts for actual repayment schedules, fees, day-count conventions, or how benchmark rates are incorporated into real contracts.
To apply this example to your company's budget, you must first verify whether the balance in question is actually exposed to the same rate change. Exact costs should be calculated based on contracts and financial institution notices. The goal is to clearly show the boundaries of the assumptions, rather than making the numbers look smaller or larger.
The Second Map: Dollar Invoices and Currency Exchange Timing
If you pay for cloud services, advertising, or external tools in US dollars, try separating service unit costs, exchange rates, and usage volumes. Even if your billing amount in local currency increases, you cannot immediately know whether it is due to a service price increase, higher usage, or foreign exchange translation effects. Nor can you determine the direction of the exchange rate on the next payment date based solely on a policy rate hike.
Keep the supplier's currency, scheduled payment date, and recent usage together on your team's cost sheet. If your team already has dollar revenues, you can also compare the timing of disbursements and inflows. This is an exercise in checking the currency and timing of your cash, not a recommendation for specific foreign exchange or hedging transactions.
The Third Map: The Lag in Customer Demand
The speed at which financial conditions transmit to demand differs by customer and product. Long-term contract clients, monthly subscription customers, and consumer goods purchasers may not react in the same way on the same day. Lowering revenue assumptions across all customer segments by the same margin based on a single piece of macroeconomic news can obscure internal differences.
Review recent conversion rates, renewals, cancellations, and payment delays as separate metrics. If movements appear, examine them alongside pricing changes, product issues, or seasonality. The mere fact that something occurred around the same time as a rate decision does not prove causation.
Boundaries for Reading Headlines and Outlooks
Following a rate hike, the possibility of further increases easily becomes the focus of market narratives. However, this article does not measure market-wide expectations or investor sentiment. Because policy decisions, participant projections, and market pricing are each distinct data sets, it is best not to take one as definitive proof of another.
There are also risks in the opposite direction. For businesses with little borrowing and stable cash inflows, the immediate direct impact may be limited. Conversely, for teams nearing a refinancing window, the terms at the time of contract renewal may matter far more than next month's rate. Your own maturity profile comes before industry averages.
A One-Pager to Keep from Today's Meeting
List the major interest reset dates and dollar payment dates for the next three months, and flag only those expenses that could actually change. Next, establish internal metrics to track customer demand along with the next review date. For figures you have not yet confirmed, it is better to leave them marked as unconfirmed and assign an owner rather than hiding them under estimates.
While this decision shifted the target range, it does not provide the right answer for individual businesses. Only by tracing the link down from policy figures to contract terms, cash schedules, and customer metrics can it be used for operational judgments. This article is an economic commentary intended for informational purposes and does not constitute individual investment or financial advice.