
GDP at 2.2%, private demand at 4.6%: two views of the same US quarter
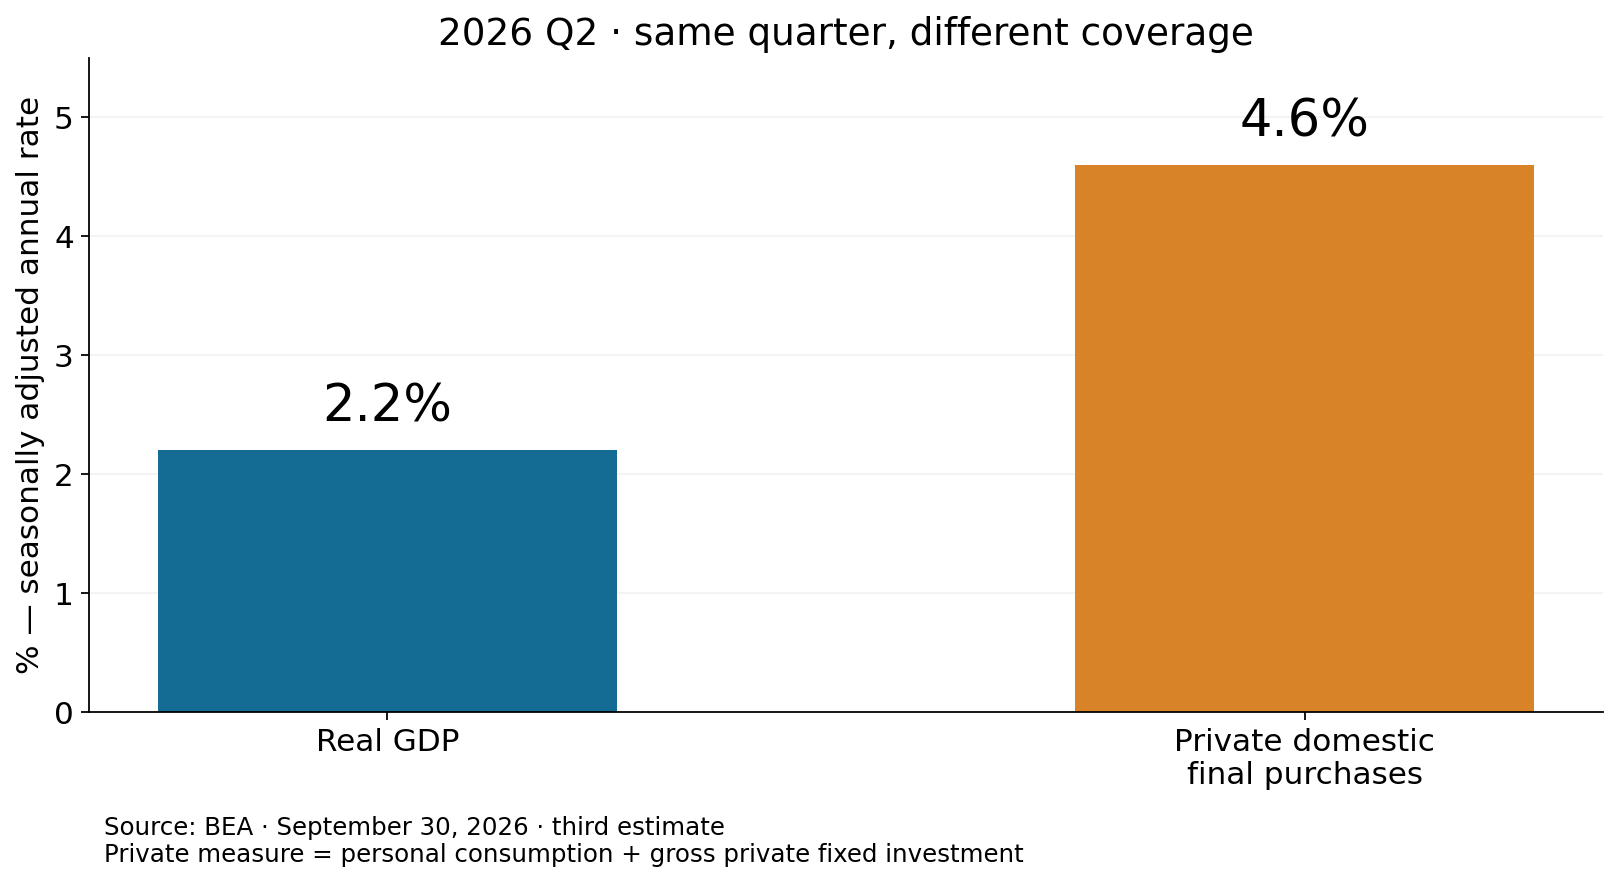
Two growth rates sit in the same US economic release: 2.2% and 4.6%. The first measures real GDP in the second quarter of 2026. The second measures consumer spending plus private fixed investment. They can sound like competing accounts of the economy, but they describe different scopes within the same quarter.
Two numbers to revisit before the next release
BEA’s September 30 third estimate put second-quarter real GDP growth at a 2.2% annual rate from the preceding quarter. Real final sales to private domestic purchasers grew 4.6%. Both are seasonally adjusted annual rates, so their units match; the transactions covered by the two measures do not.
The BEA calendar checked October 24 schedules the third-quarter advance GDP estimate for October 29 at 8:30 a.m. US Eastern time, or 9:30 p.m. in Korea that day. Understanding the previous release’s two measures provides context for that event without guessing the upcoming number. It also gives a more useful starting point than treating every headline percentage as the same kind of demand signal.
Where shopping and equipment purchases belong
Real final sales to private domestic purchasers is the sum of personal consumption expenditures and gross private fixed investment. Its scope captures household purchases and fixed investment such as business equipment, structures and residential investment. Government spending, inventory investment and net exports are outside that particular sum, although they enter GDP.
For example, households can buy more services and businesses can acquire more equipment while inventory or trade movements leave total GDP growing at a different pace. Looking at final purchases by private domestic buyers helps bring that demand pattern into view. The 4.6% figure still does not mean every industry’s sales, or every household’s purchases, rose at that rate; it describes the aggregate covered by the measure.
The 2.4-point gap is not a component contribution
Subtracting the chart’s two bars gives 2.4 percentage points. That is a difference between growth rates of differently defined aggregates. It is not evidence that inventories subtracted 2.4 points from GDP, or that net exports contributed precisely the gap. Component contributions must be read from BEA’s separate contribution tables rather than inferred from these two rates.
Imports illustrate why scope matters. They are subtracted in GDP accounting to remove foreign production already included in consumption or investment. Buying an imported item does not by itself erase the same amount of domestic output. Domestic distribution and transport value added must be distinguished from the foreign-produced content. That accounting logic helps keep a demand story from turning into an incorrect claim about lost production.
One quarter, several estimates
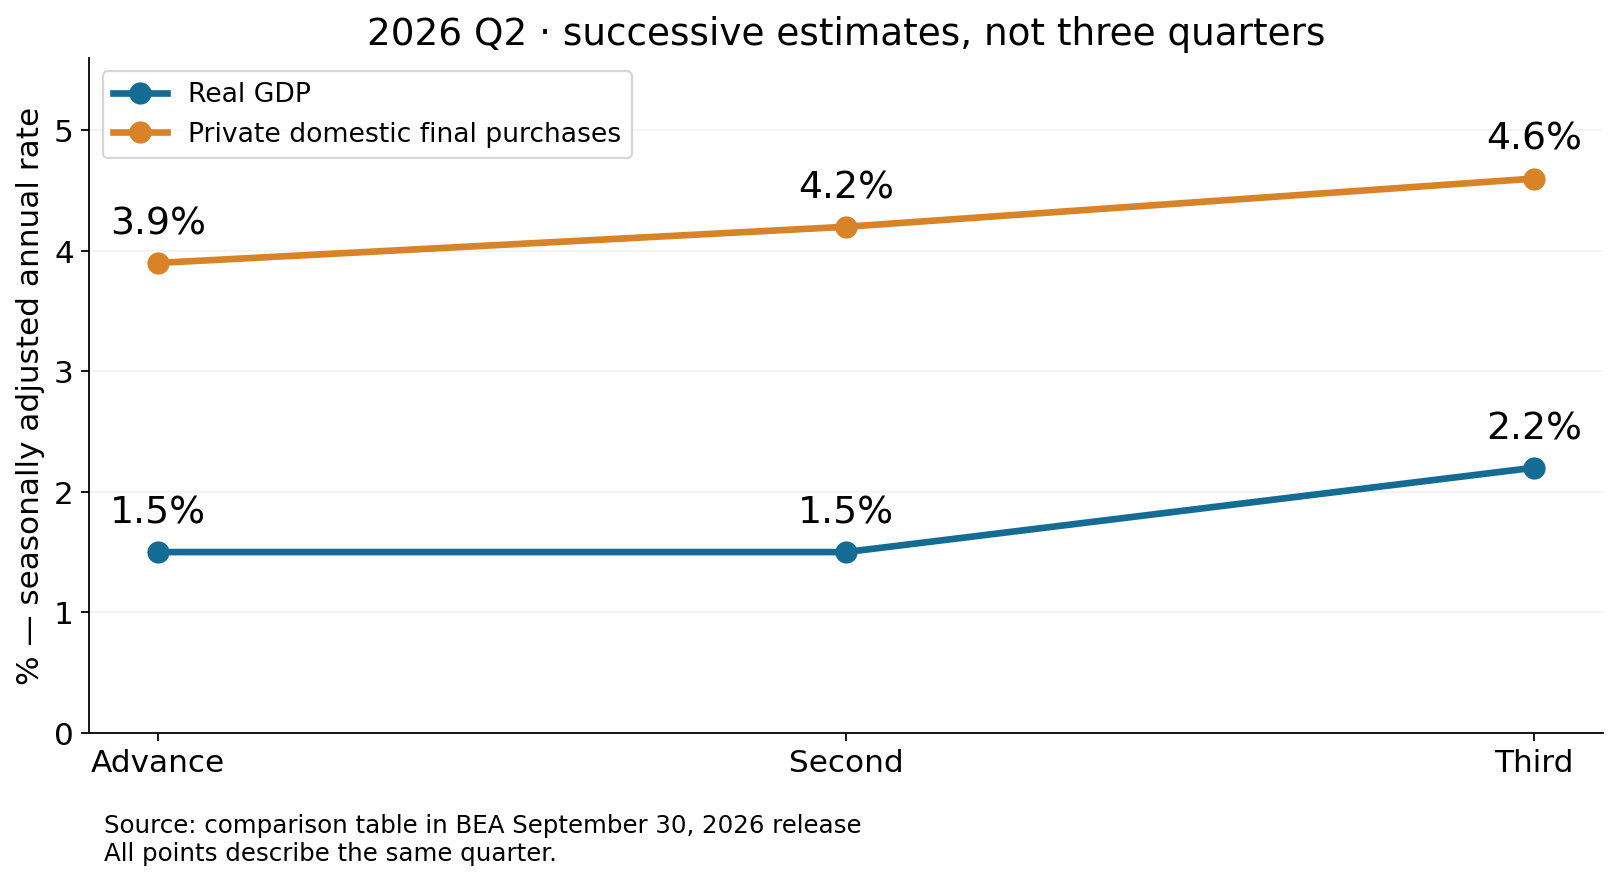
The September 30 release’s comparison table shows second-quarter GDP at 1.5%, 1.5% and 2.2% across the advance, second and third estimates. The corresponding private-demand measure reads 3.9%, 4.2% and 4.6%. The second chart reproduces that comparison. It is a sequence of estimates for one quarter, not growth across three quarters; additional information can change the pace that a release appears to describe.
Next week’s GDP headline will attract attention, but put the consumer-spending-plus-fixed-investment measure beside it. Ask whether total production and private final purchases move in the same direction and which accelerates more. Those questions add dimension to an economic headline without requiring a market forecast. This article explains economic statistics and is informational, not investment advice.
Sources and further reading
BEA · 2026 Q2 third estimate · 2026-09-30
BEA · Imports and inventories · FAQ 1480
Federal Reserve Education · Imports in GDP
Schedules can change. Q3 advance GDP and September Personal Income and Outlays are currently due at the same time; keep those releases distinct from the Q2 figures above.