
US initial jobless claims fell. Why did continuing claims rise?
A fall in new unemployment-insurance claims sounds like an uncomplicated improvement in the labor market. The US Labor Department’s October 22 release contains another movement, however: the number already receiving insurance rose. Fewer new claims and a larger continuing caseload can coexist because they describe different parts of the system. Reading both offers a more useful picture than treating one headline as a complete account of finding and keeping a job.
Fewer new claims entered the system
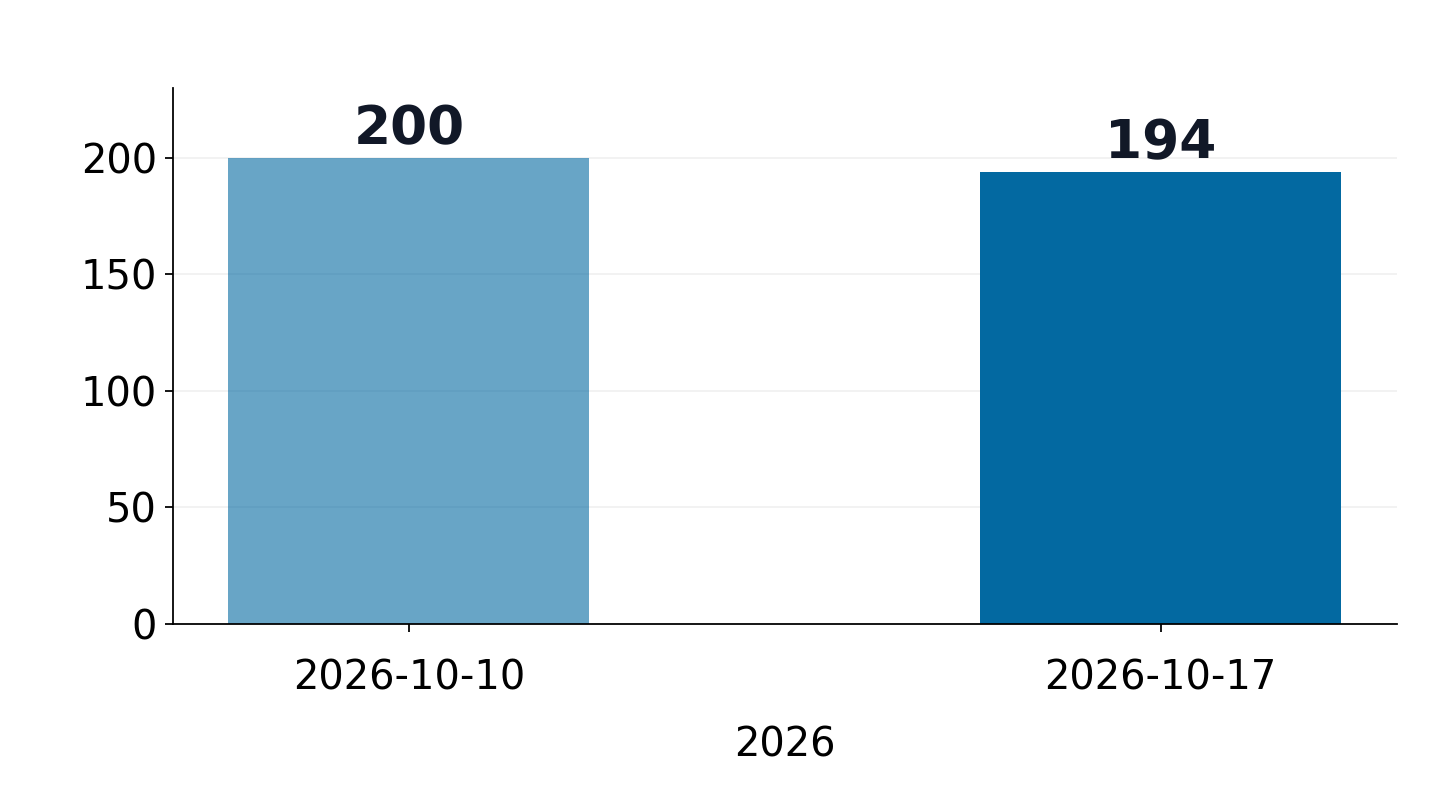
Seasonally adjusted initial claims were 194,000 for the week ending October 17, down 6,000 from the preceding week’s revised 200,000. That earlier week had initially been reported at 199,000 and was revised up by 1,000. The new weekly change therefore uses 200,000 as its starting point. Comparing the new result with an old note of the first estimate would produce a different change.
The four-week moving average also declined, reaching 197,750, down 1,000 from the revised previous average. Both the latest week and the smoother average pointed toward fewer new claims. Initial claims describe entry into the insurance system, though. They do not directly count people who found employment, and a decline should not be read as a matching increase in successful job searches.
The continuing caseload moved the other way
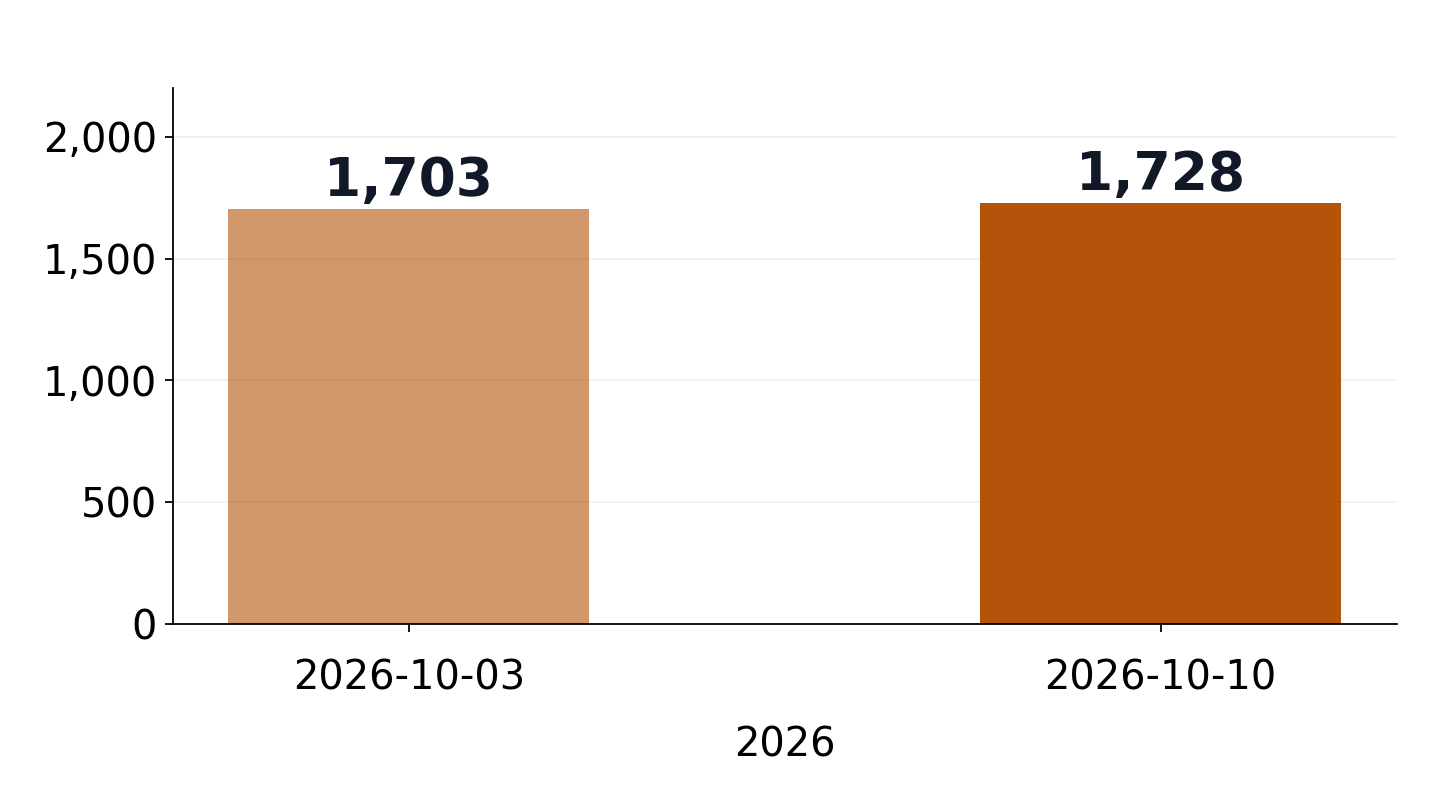
Seasonally adjusted insured unemployment reached 1,728,000 for the week ending October 10, up 25,000 from a revised 1,703,000. Its four-week average rose 4,000 to 1,711,000. Notice the reporting dates: the latest continuing measure refers to a week one week earlier than the latest initial-claims measure. Both charts label their own dates rather than suggesting they cover an identical week.
The combination is consistent with fewer people entering while existing recipients leave more slowly. A slower return to work is one possible interpretation, but this release alone cannot attribute every additional continuing recipient to that cause. Eligibility and the end of benefit entitlement also affect who remains counted. The figures describe the insured population, with its own entry and exit rules, rather than every unemployed person in the economy.
Subtracting the two does not produce hiring
A café queue offers a useful analogy: the people who joined during an interval are a flow, while the people still waiting are a stock. The queue depends on departures as well as arrivals. Insurance is more complicated, and these two published measures also differ in reporting week and definition. Subtracting initial claims from continuing claims is therefore not a way to calculate the number of hires or the number of people who failed to find work.
The insured unemployment rate remained 1.1%. Its denominator is employment covered by unemployment insurance, so it is not interchangeable with the familiar unemployment rate from a broad labor-force survey. An increase in the caseload alongside an unchanged published rate is not inherently contradictory: rounding and the denominator matter when interpreting a rate reported to one decimal place.
Beyond a one-line good-news headline
Someone employed may mainly worry about being laid off. Someone already searching may care more about how long the next job takes to arrive. A headline about fewer initial claims speaks more directly to the first concern. Adding the continuing measure makes it easier to understand why people can experience the same labor market very differently without either experience being captured fully by one weekly number.
In the next release, watch whether the decline in initial claims persists and how both continuing claims and their respective four-week averages evolve. The two charts have separate scales and are not comparisons of equally sized markets. Rather than declaring a turning point from one week, the interesting question is whether lower entry and a higher continuing caseload keep appearing together.
Source data and definitions
DOL · Weekly claims · 2026-10-22
Economic information checked on October 23, 2026, not investment advice. Charts use a separately preserved copy of the DOL October 22 release.