
US new-home inventory stayed flat. Why did nine months of supply become 8.5?
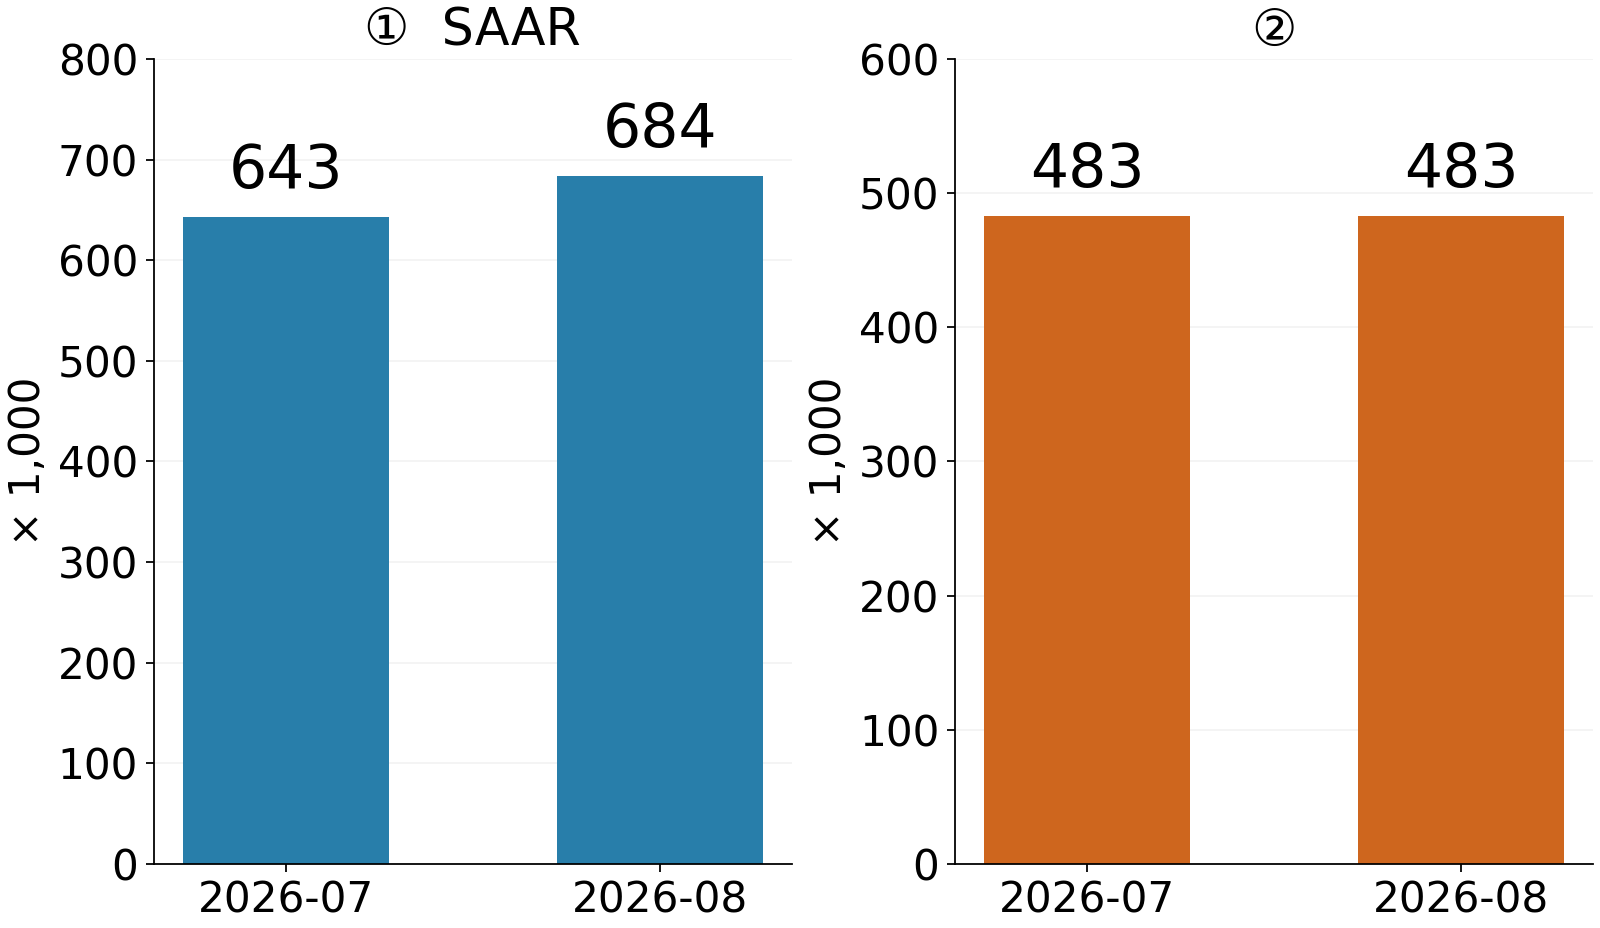
A shorter supply of homes does not always mean fewer homes remain for sale. The August US new single-family housing release offers a concrete example. In the September 24 vintage, seasonally adjusted inventory was 483,000 in both July and August, while months of supply fell from 9.0 to 8.5. The stock stayed flat; the reported selling pace changed.
The scene before the next release
The Census Bureau schedules September new-home sales for October 27 at 10 a.m. EDT, or 11 p.m. in Korea. This article was written on the morning of October 27 in Korea, before that release. The numbers below are August preliminary and July revised estimates from September 24, not advance knowledge of September results.
That release put the sales pace at 643,000 in July and 684,000 in August. Those are seasonally adjusted annual rates, or SAAR, rather than the number sold during each month. Inventory of 483,000 is the stock available at month-end. Keeping an annualized flow separate from a point-in-time stock makes the table easier to understand.
The denominator did the work
An approximate way to understand months of supply is inventory divided by the monthly selling pace. Using published rounded figures gives 483,000÷(643,000÷12), about 9.01 months, for July and 483,000÷(684,000÷12), about 8.47, for August. That explains the published 9.0 and 8.5. Rounding and calculations from underlying data can prevent exact agreement in the final digit.
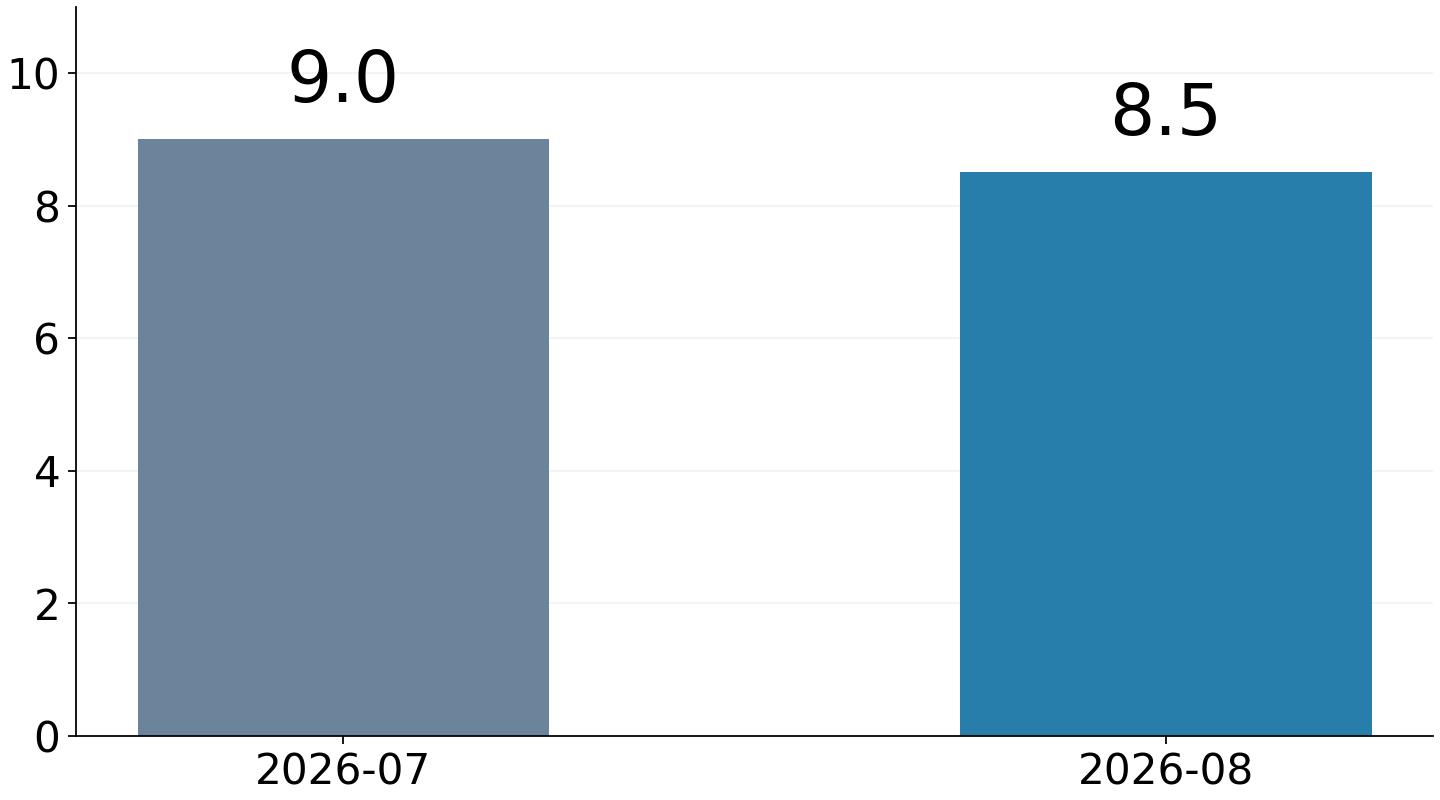
At a faster selling pace, the same stock represents fewer months. Imagine a bookshop with 120 books: selling ten a month gives twelve months of stock, while fifteen a month gives eight. Housing is more complex, but the denominator works the same way. Reading a lower months-of-supply figure as a fall in the number of available homes would miss this mechanism.
A wide interval around the sales gain
The release estimated a 6.4% monthly sales increase with a 90% confidence interval of ±19.5 percentage points. Roughly -13.1% to +25.9% includes zero, so the sample does not establish the direction of change statistically. The estimate remains informative, but that wide interval makes a single monthly rebound insufficient to declare a recovery.
A new-home sale also differs from a closing or move-in. The survey counts a deposit accepted or a sales agreement signed, including some sales before permits are issued. Preliminary estimates can be revised. When the next report arrives, changes to the previous month belong alongside the new headline.
Two lines to carry into the new report
When September figures arrive, place inventory and annualized sales side by side. Another fall in months of supply could come from less inventory or faster selling, with different implications. Conversely, inventory can shrink while months of supply rise if sales slow even more. The pair explains movement that the ratio alone cannot.
The memorable feature of the August vintage is that the same 483,000 homes represented both nine months and 8.5 months of supply. Inventory is a stock, sales a pace, and months of supply their ratio. Remembering that relationship makes the next release more intelligible. This is economic explanation, not financial advice.