
Copilot now sees OpenCode traffic: why request counts can suddenly look higher
If work in VS Code appeared in your Copilot report while work in OpenCode did not, the tools may simply have been visible to different measurement systems. GitHub’s October 23 update adds totals_by_client to the usage metrics API, bringing model traffic sent through Copilot by tools outside the IDE into view. A jump in the chart can therefore tell a story about measurement as well as activity.
Usage that moved outside the editor
The existing totals_by_ide relies on editor telemetry that some external tools do not send. The new grouping counts model requests on the server, closing that visibility gap. It covers traffic using Copilot as the model provider; it does not claim to capture everything the named tool does through other providers or subscriptions.
The array is available in enterprise, organization and their per-user reports, in both 1-day and 28-day versions. In aggregated 28-day reports it sits inside each day_totals entry. This is an additive change: existing fields remain unchanged and the array is empty when there is no usage to report. Adding its total to IDE totals without checking overlap can count the same activity twice.
One prompt can produce several requests
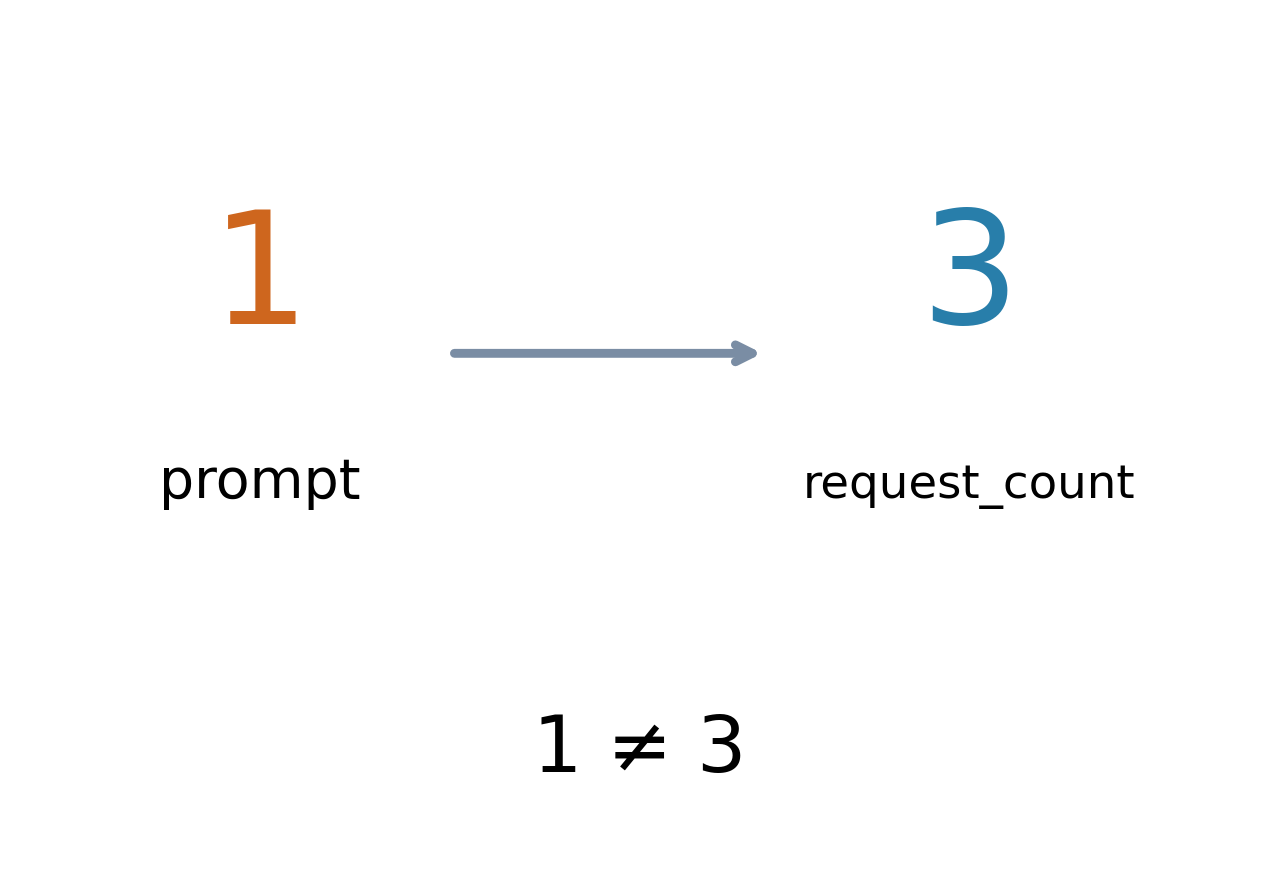
request_count counts successful model calls rather than user prompts. Consider an illustrative request to fix a failing test. Reading the relevant context, producing a change and reviewing the result could involve three model calls. In this deliberately hypothetical example there is one prompt but request_count is 3. The illustration is explanatory, not a measurement of an actual tool run.
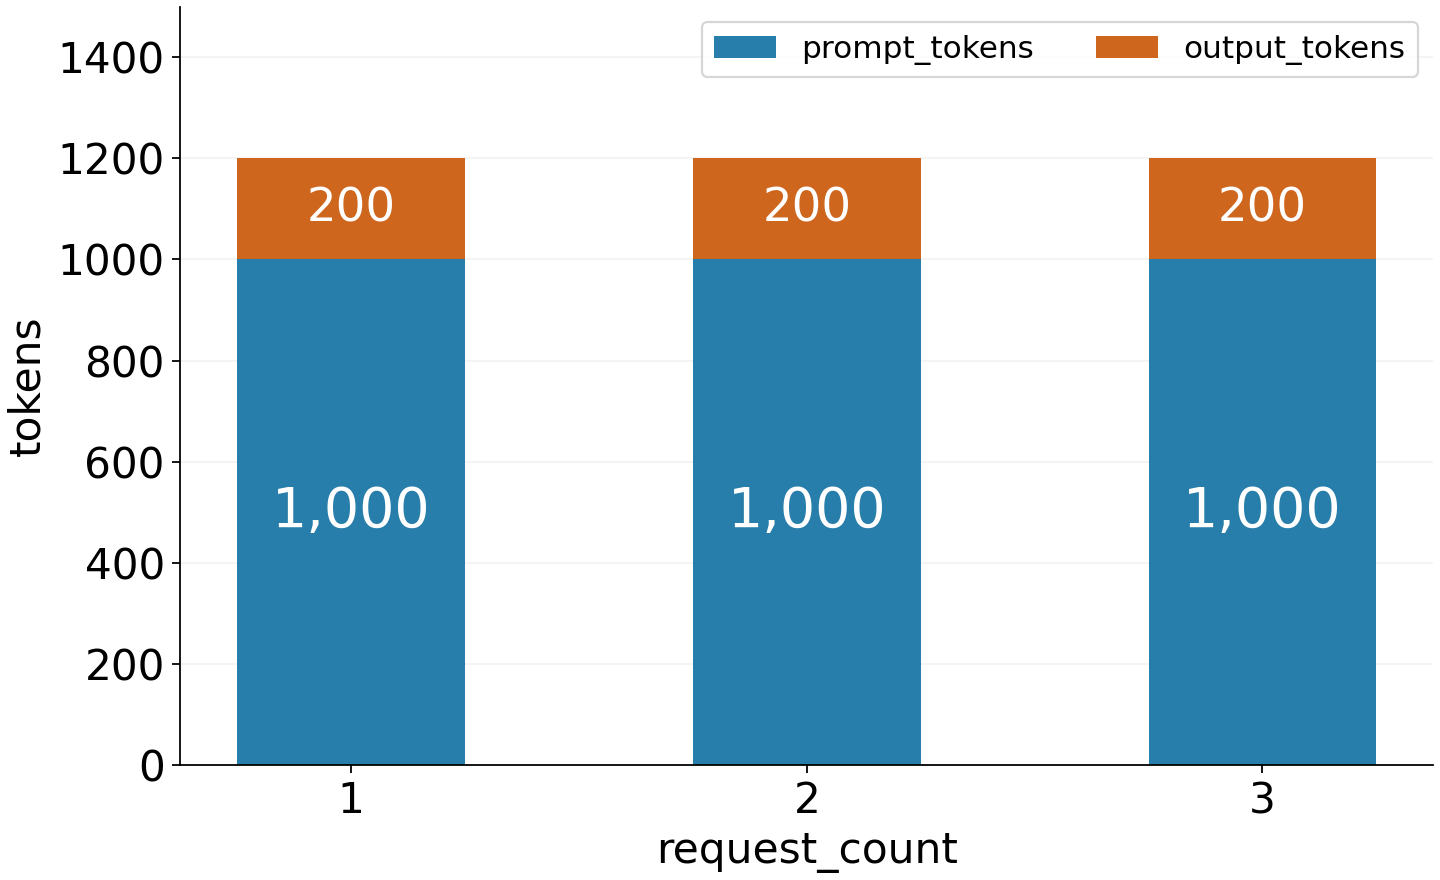
session_count counts distinct sessions. token_usage includes prompt tokens, output tokens and average tokens per request. In a second illustrative calculation, three calls using 1,000 input and 200 output tokens apiece sum to 3,000 input and 600 output tokens. A tool that splits work into many calls can rank differently by request volume and token volume from one that sends a large context in fewer calls. Neither ranking alone establishes quality or productivity.
Read the model together with the client
Within each client, totals_by_model breaks down model requests and tokens and includes model_selection_mode. user_selected indicates a direct choice, auto an automatic selection and product_selected a choice made by the product. Copilot code review and cloud agent report product_selected; code review model names are reported as unknown.
The client grouping comes from the integration ID supplied with a request. Names can include opencode, claude_code, codex and vscode, while unrecognized clients fall under other. It is a best-effort grouping rather than verified identity. An entry named codex therefore does not mean this report captures all OpenAI traffic or usage billed under a separate subscription.
What a rising report actually tells you
GitHub’s agent app activity counts jobs started by agent apps such as Claude and Codex on GitHub. That is a different unit from model traffic. A single job can make several calls, so dividing job counts by model requests as though they formed a simple conversion funnel can produce a misleading result. Choose whether you are comparing prompts, jobs or model calls before building the chart.
Access requires the Copilot usage metrics policy and an eligible owner, billing-manager or custom metrics-viewing role. When a report rises after the change, match the date window and report scope, then look for clients that have become visible. Newly observed work can move the graph even without a change in developer behavior. Separating expanded coverage from increased activity is the useful first step.