
US median weekly earnings of $1,232: not a raise for the same worker
If a national pay headline rises, should a small team increase its next offer by the same percentage? The middle of a nationwide earnings distribution and the price of hiring a particular role answer different questions. The BLS third-quarter release published on October 21, 2026 is useful context, provided its population and comparison basis travel with the number. This article focuses on the distinction between a shifting distribution and a pay increase received by the same individual. That distinction matters before any calculation is copied into a budget.
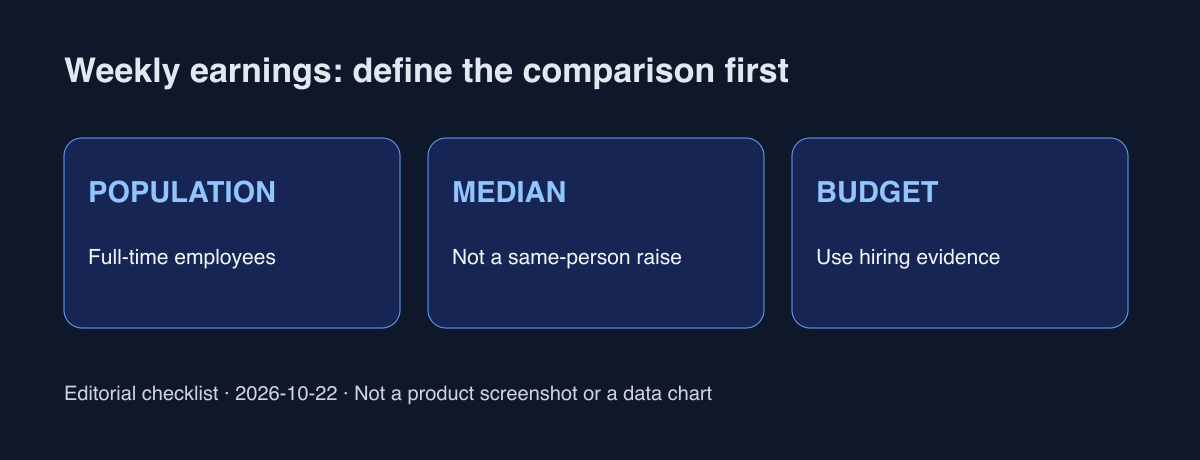
Confirmed figures and their comparison basis
BLS reported unadjusted median weekly earnings of $1,232 for full-time wage and salary workers, up 1.5% from a year earlier; CPI-U rose 3.5% over that period. A separate seasonally adjusted series was $1,239, below $1,258 in the preceding quarter. Label the unadjusted year-over-year comparison and the adjusted quarter-over-quarter comparison explicitly. Connecting $1,232 and $1,239 as consecutive observations would manufacture a movement from a difference between series. These are published observations, not a forecast for the next quarter.
The median is not the same person’s payslip
The technical note defines the median as the midpoint of an earnings distribution. Earnings are before deductions and include usual overtime, commissions, and tips from the main job. Self-employed people are excluded, and full time generally means at least 35 hours a week. This is therefore neither founders’ business income nor disposable income for all households. BLS also explains that changing subgroup weights can lower an overall median even when subgroup medians rise. The headline alone cannot establish how much the same people received in raises. A distribution can move because its membership changes as well as because pay changes.
Three questions before using the release in a team budget
Are the role, geography, and usual working hours comparable? Have cash earnings been separated from benefits and employer costs? Is there evidence from actual offers and acceptances? These questions are an editorial proposal for small teams, not an official BLS budgeting instruction. Keep the national median as background and attach comparable role-level hiring records to the decision. If converting weekly earnings into an annual figure, verify the assumption behind that conversion separately: usual weekly earnings are not automatically a guaranteed annual contract amount. The useful budget memo records both the external reference and the internal evidence.
Keep price pressure and composition in the same discussion
Nominal earnings growth below inflation is a reason to examine purchasing power. Turning the difference into every worker’s personal real-pay loss would erase differences in population and distribution. Record changes in hiring composition separately from changes to a continuing worker’s pay. Sampling also makes it unwise to declare a durable trend from a small movement alone. Conversely, possible composition effects do not make living costs irrelevant. Actual income histories and household spending patterns remain necessary for an individual assessment. Neither a reassuring headline nor an alarming subtraction replaces that evidence.
Everyday discussion often calls this “average pay rising”; a review should instead identify the population, median, and period. This article does not quantify community sentiment or predict equities and interest rates. At the next update, retain the same series and definitions and check revisions before comparing. This is informational content, not financial or investment advice.
Official sources and definitions
BLS · Q3 2026 usual weekly earnings
Attach population, seasonal-adjustment status, comparison period, and internal evidence when copying a pay figure into a budget note.