
The $78,535 US Consumer Expenditure Trap: Why Average Household Spending Cannot Set Your Subscription Pricing
If average annual consumer expenditures in the United States reach $78,535, does a subscription service costing a few dollars a month feel insignificant? The moment you interpret overall spending as a budget your product can capture, an ostensibly plausible market size can diverge sharply from actual customers.
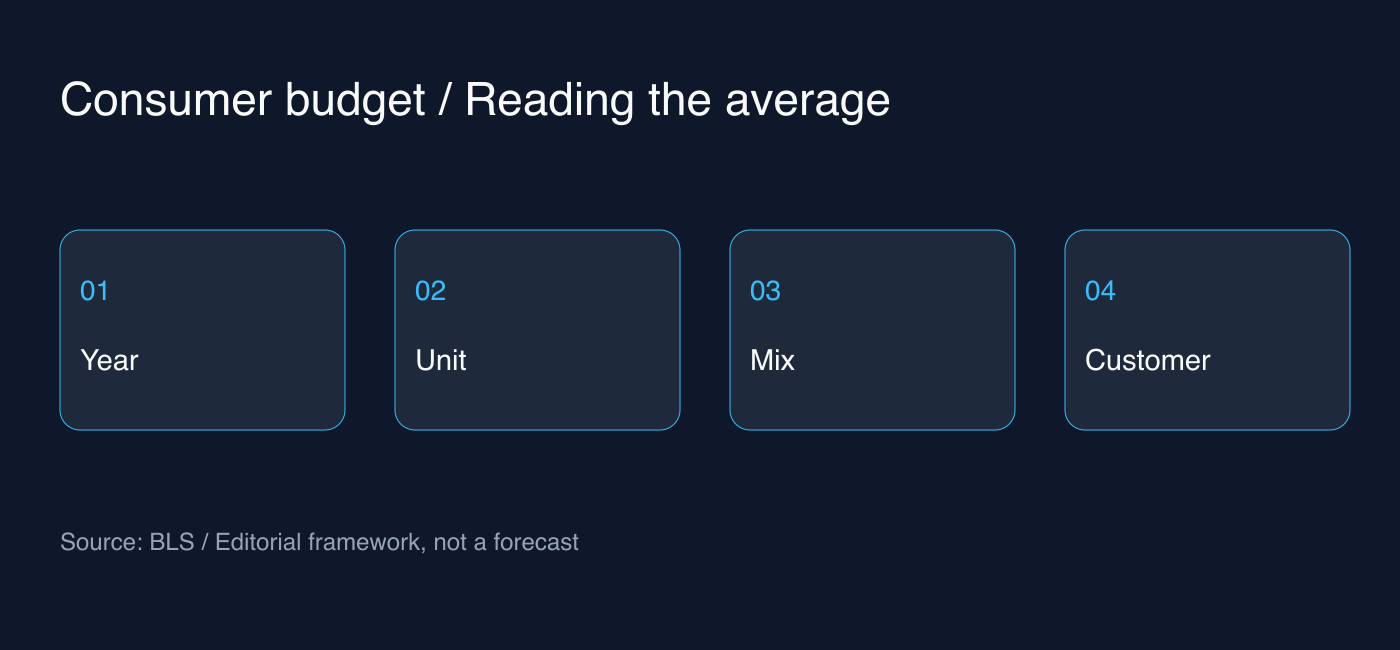
The report published by the BLS in August 2026 analyzes 2024 consumer expenditures. Because the publication date differs from the observation year, these figures do not reflect real-time consumer economic conditions in September 2026. This article explores the interpretive boundaries when applying this data to pricing and customer research.
Even When Dollar Amounts Rise, Real Spending May Differ
In the report, average annual expenditures per consumer unit in 2024 were $78,535, up 1.8% from the previous year. Over the same period, the CPI-U increased by 2.9%, and the BLS explains real spending growth as -1.1% using the difference between these two rates.
One should not directly equate this increase in spending with higher purchasing volume or expanded financial leeway. This is because changes in prices, purchase mix, and consumer choices are all bundled together. Nor can these figures alone predict whether paid conversion rates for a specific app will rise or fall.
The Unit of Average Is Not an Individual User
This report analyzes data based on consumer units (CUs), and income and expenditures are in nominal dollar amounts. This denominator is not equivalent to a single account or a monthly active user of your product.
Dividing the annual average by twelve months yields merely a mathematical conversion, not freely disposable monthly budget. Substantial one-off expenditures can occur throughout the year, and your actual customers' household composition and income distribution may diverge from national averages.
Rising Housing Costs Do Not Mean All Subscriptions Decline
In the BLS tables, housing-related expenditures accounted for 33.4% in 2024. The combined total of five major categories—housing, transportation, food, personal insurance and pensions, and healthcare—constitutes 83.7% of the total.
Do not calculate the remaining share entirely as a potential budget for digital services. Statistical expenditure categories do not map one-to-one to the value a product delivers, and choices may differ between customers who use the same service for leisure and those who use it to save work hours.
Customer Hypotheses Small Teams Can Build
The suggestions below are interpretations for business operations rather than forecasts from the BLS. Rather than segmenting customers solely by average income, try framing interview questions around the expenses your product replaces or the time it saves.
For instance, you can distinguish whether the reason for churn was price, usage frequency, or overlap with other tools. If you immediately offer discounts, it becomes harder to verify whether an issue that appeared to be about price was actually driven by onboarding friction or feature discoverability.
Pricing Experiments Leave Consequences Beyond Revenue
When testing new pricing, determine the observation period and target audience first, and monitor cancellations, refunds, and support tickets alongside conversion rates. Even if revenue increases, if usage among long-term customers drops, you must interpret short-term gains separately from retention effects.
In small sample sizes, the reactions of one or two customers can swing percentages dramatically. Rather than treating national statistics as the definitive answer for your experiment, it is more appropriate to use them as contextual background to determine which customer questions to investigate further.
A Framework for Validating Claims of a Consumer Slowdown
Explaining trends as weakened consumer spending tends to bundle multiple distinct phenomena together. This article does not present reactions from specific online communities as representative public opinion, nor does it conclude that customer churn is driven by macroeconomic factors.
Verify the base year and distinguish nominal from real figures, examine data from relevant consumer cohorts, and then compare your product's actual usage and billing records with customer explanations. Separating macroeconomic conditions from product-specific issues clarifies whether you should prioritize price reductions, improved value delivery, or cost management.
Notes to Keep in Mind When Reading Future Data
When new consumer expenditure data is released, do not merely swap out the headline total; verify the target year, table definitions, and any revisions first. For the same reason, one should not directly apply US consumer unit data to Korean customers or corporate software budgets.
This article provides informational context for understanding economic data and does not constitute investment advice. It does not recommend buying or selling any specific asset or promise returns.