
September US real earnings: a pay rise can still buy less
A higher pay rate can coexist with weaker purchasing power. In its October 14 release, BLS reported that all-employee average hourly earnings rose 0.1% in September while CPI-U rose 0.6%. Seasonally adjusted real average hourly earnings therefore fell 0.5%. Our earlier article separated these measures before the release; this follow-up applies that framework to the published results rather than repeating a forecast.
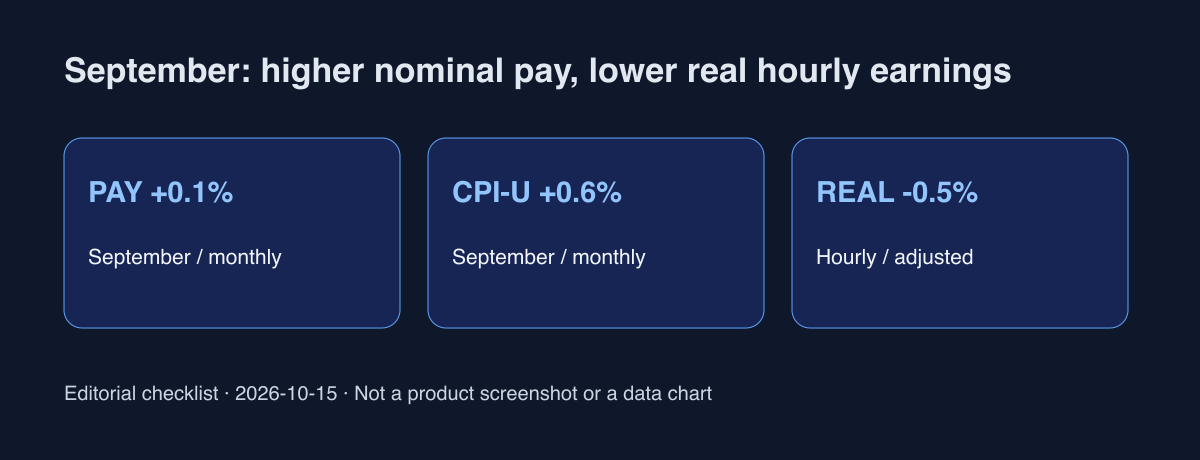
What the monthly result covers
Real average weekly earnings also fell 0.5% over the month, with the average workweek unchanged. These are aggregate averages for employees on US private nonfarm payrolls, not an individual's payslip. They do not measure Korean wages or purchasing power in won. All three figures in the diagram describe the same September monthly comparison, so the visual should not be read as a personal earnings history.
Keep monthly and annual comparisons separate
For all employees, real hourly earnings were down 0.7% from September 2025, while real weekly earnings were down 0.1%. A 0.6% increase in the average workweek over that year helps explain the difference. Mixing the monthly decline with the annual comparison can create an apparent acceleration or recovery that those numbers do not establish. Keep the period beside each figure before interpreting the direction.
Do not combine employee populations
Production and nonsupervisory employees recorded a 0.6% monthly fall in real hourly earnings. Their calculation uses CPI-W, whereas the all-employee calculation uses CPI-U. Selecting the larger decline and presenting it as the all-employee result changes both the population and the price adjustment. For subsequent releases, return to the same table and column rather than comparing whichever headline looks more striking.
How a small team can use the evidence
The following is interpretation and an operational proposal. Weaker average purchasing power is a reason to examine price sensitivity, not a prediction that a particular service will lose revenue. Check paid conversion, cancellation reasons and failed payments using your own data. Do not select a price increase or promotion date from this wage measure alone. When revenue and costs use different currencies, record exchange-rate effects separately instead of attributing every margin movement to US wages.
A household can apply the same separation: record actual take-home income, paid hours and prices of frequently purchased items. Then investigate why its experience differs from the average index. A smaller fall in weekly earnings does not itself mean hourly purchasing power recovered; additional hours can change the weekly result. This article uses no invented household income, investment return or customer-demand estimate.
One month cannot settle the path of total consumption or interest rates. Workforce composition and later revisions remain relevant limitations. The release lists the next real-earnings publication for November 10 at 08:30 US Eastern Time; recheck the official schedule before acting. This article is informational and is not financial advice. Keep period, population and hours beside the purchasing-power measure rather than reducing the story to a single headline number.
Official sources
BLS · Real earnings technical note
BLS September real-earnings release and technical note checked October 15, 2026. Reported data is separated from budgeting proposals.