
US retail sales rose 0.8%: gasoline stations took 71% of the dollar increase
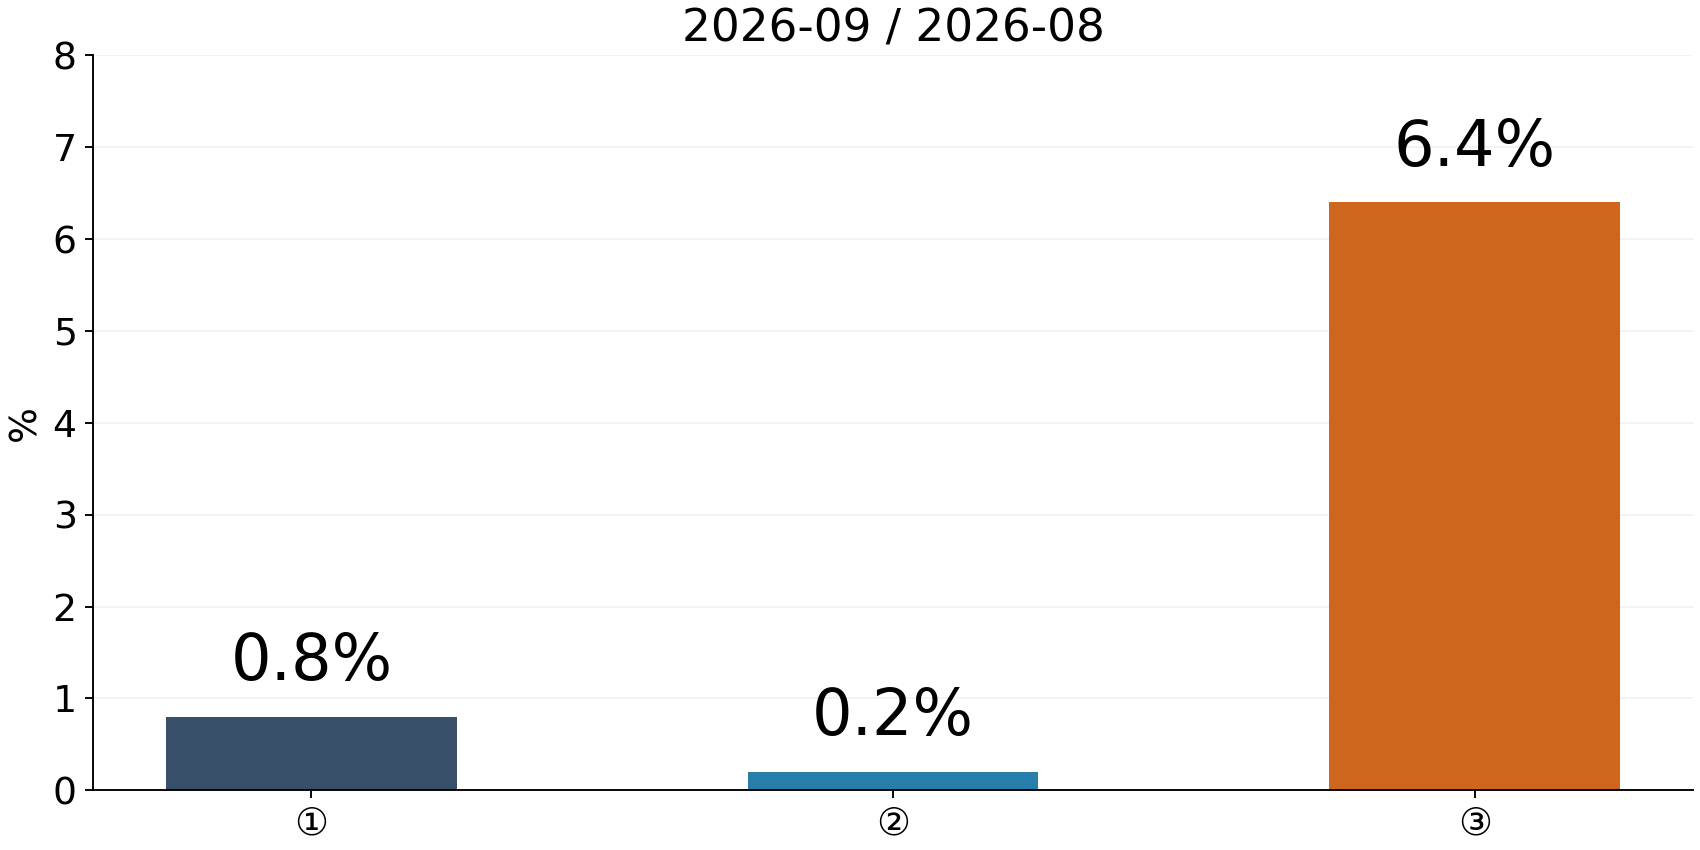
A stronger-shopping headline and a heavier fuel bill can describe the same month. US retail and food services sales rose 0.8% in September, according to the October 15 release. Excluding gasoline stations, the increase was 0.2%. Dividing the official dollar totals makes the concentration of that increase much easier to see.
Of a $5.7 billion increase, $4.1 billion was at gasoline stations
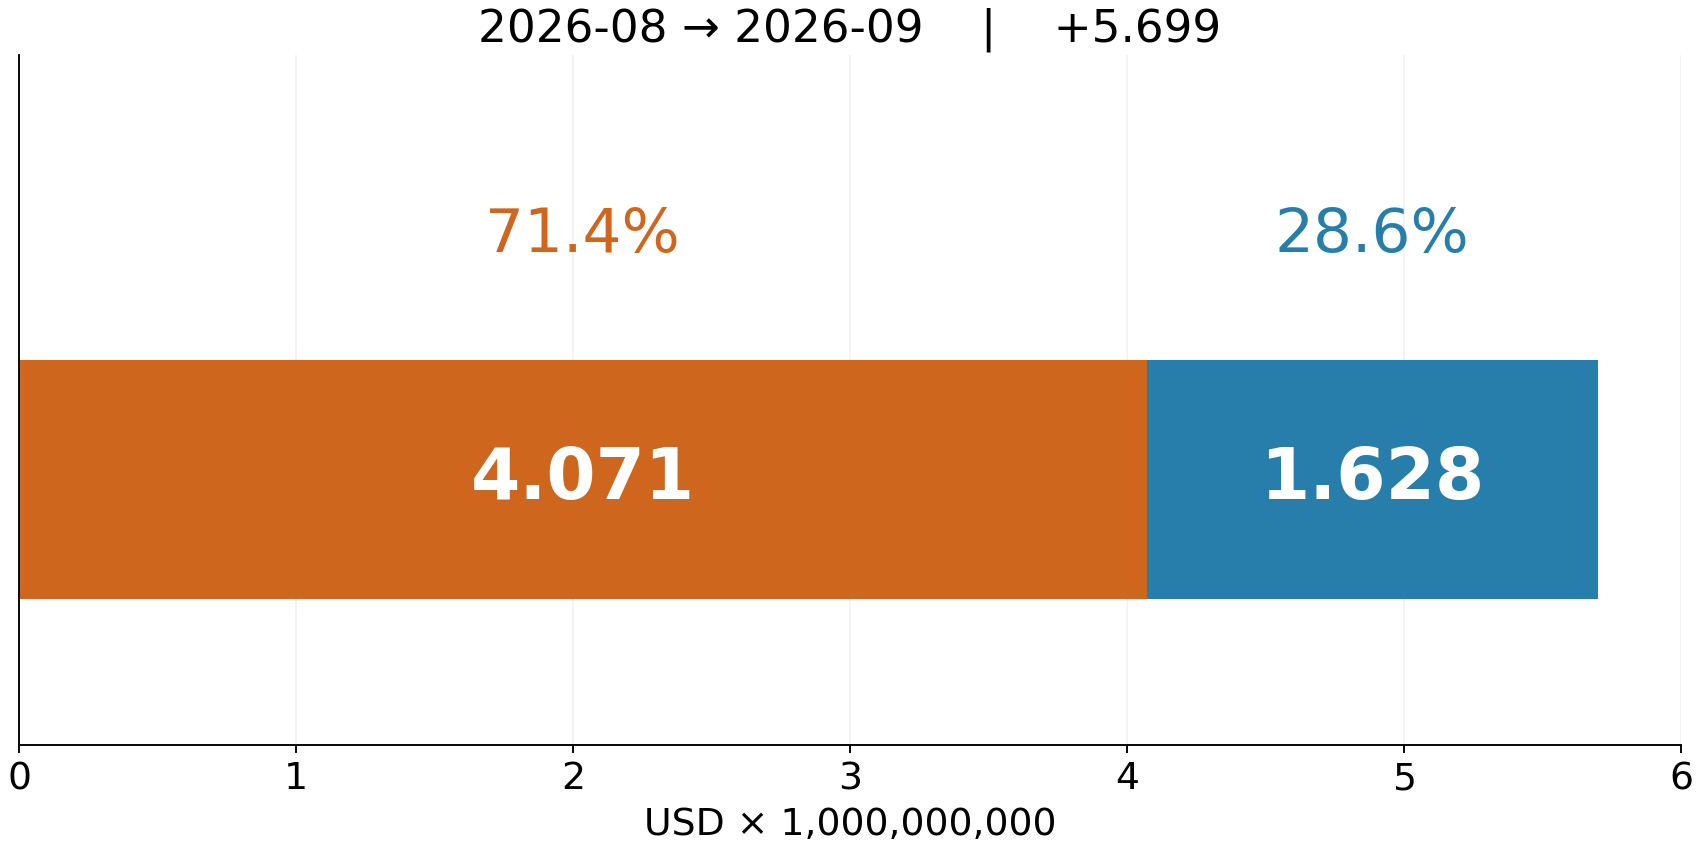
Sales adjusted for seasonal, holiday, and trading-day differences rose from $739.322 billion in August to $745.021 billion in September, a $5.699 billion increase. Gasoline-station sales in the same table rose from $63.950 billion to $68.021 billion, an increase of $4.071 billion. That is about 71.4% of the increase in total dollars.
The chart below splits the gain into $4.071 billion at gasoline stations and $1.628 billion everywhere else. The 71.4% figure is not gasoline stations’ share of all retail sales. It is their share of the change between the two months. Distinguishing the sales level from the increase can substantially change how the headline feels.
The picture changes when gasoline stations are excluded
The 0.8% headline rate and the 0.2% excluding gasoline stations have different denominators. Rather than subtracting them and calling 0.6 percentage points an exact contribution, comparing dollar changes on the same adjustment basis is clearer. The 71.4% in the first chart is also an approximation calculated from the published, rounded dollar totals.
Sales excluding gasoline stations rose from $675.372 billion to $677.000 billion. Gasoline-station sales rose 6.4% month on month. Revenue reflects both prices and quantities, however. This table alone cannot establish precisely how much came from buying more fuel and how much from paying more for the same amount.
Why higher receipts do not necessarily mean more shopping
These retail figures are not adjusted for price changes. For a fictional illustration, buying 10 gallons at $4 per gallon costs $40; buying the same 10 gallons at $4.40 costs $44. Spending rises while volume stays unchanged. This is an explanatory example, not a reconstruction of actual September gasoline prices.
The totals therefore do not establish that household finances became more comfortable. Higher fuel bills could leave less for other purchases, but measuring actual substitution requires other evidence. Retail and food services sales also do not capture all spending on travel, accommodation, or medical care. BEA’s personal consumption expenditures, or PCE, cover goods and services more broadly and provide useful companion context.
The consumer picture behind the number
Advance estimates arrive quickly and can be revised. Census describes an initial estimate based on roughly 4,800 sample units, followed by revisions using the larger monthly survey. In this release, August growth was revised from 1.1% to 1.3%. Read September as the October 15 vintage, then look for whether its pattern persists in the next release.
The useful question goes beyond “Americans spent more.” Asking where the extra dollars went and what experience or volume they represent reveals smaller changes at other stores behind a large gasoline-station movement. This article is for information and is not financial or investment advice.
Sources and further reading
Census Bureau · September 2026 · 2026-10-15