
U.S. Real Hourly Earnings Fell While Weekly Earnings Rose in August: Why Work Hours Matter When Reading Spending Power
Headlines stating that wages failed to keep pace with inflation and headlines claiming weekly purchasing power improved can both emerge in the exact same month. This is because hourly earnings and weekly earnings are linked by work hours. Looking only at the direction of the numbers makes it easy to misinterpret the same dataset as conflicting signals.
The August 2026 data released by the BLS on September 11 is one such example. This article explains how to interpret the metrics based on official data verified as of September 16. It does not presuppose the outcomes of future releases or revisions.
Verified Figures: Hourly and Weekly Trends Diverged
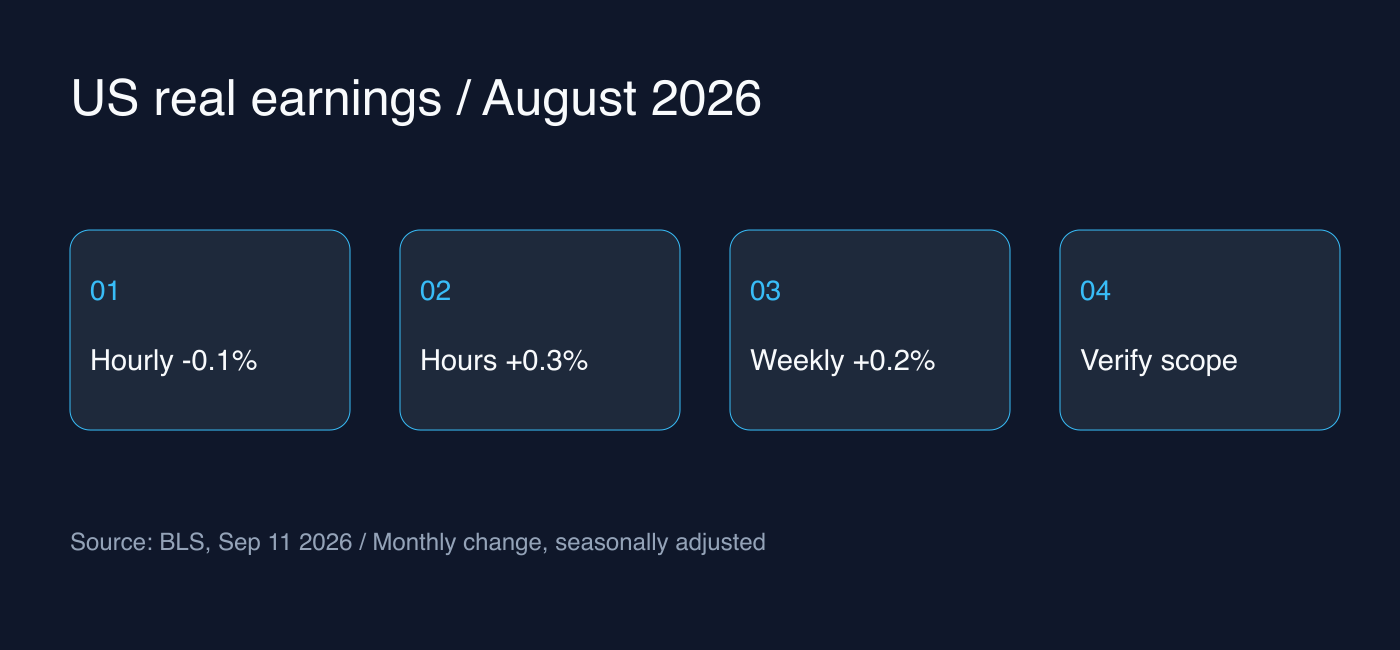
For all private nonfarm payroll employees, real average hourly earnings decreased by 0.1% from July. While nominal average hourly earnings rose by 0.3%, the CPI-U increased by 0.4%, resulting in this net decline. All month-over-month figures discussed here are seasonally adjusted.
In the same report, average weekly hours increased by 0.3%, and real average weekly earnings rose by 0.2%. The key takeaway today is that hourly purchasing power and weekly purchasing power moved in opposite directions. Ignoring the effect of working longer hours on average and judging weekly amounts solely by hourly wage causes one to miss a crucial transmission channel.
Three Questions Readers Should Distinguish First
If you want to know how much one hour of work can buy, real hourly metrics are the starting point. If you want to track the flow of money per job across a week, look at weekly metrics alongside work hours. How much a specific household can spend more this month is a separate question that cannot be answered by this statistic alone.
Even when adding these numbers to meeting materials, it is best not to shorten the label simply to 'real wages.' Specify whether it is hourly or weekly, which target demographic it covers, and whether it is month-over-month or year-over-year. This minimizes the error of comparing figures with different baselines in the same column.
The Average Worker Differs from Your Individual Customer
The BLS technical notes explain that these data points represent averages across private nonfarm jobs and do not depict the earnings of a typical individual. Changes in the composition of employment across industries also influence the average. Therefore, one should not assume that a single customer's salary changed at the average rate.
Households have distinct circumstances, such as the number of jobs held, transfer income, debt service payments, and savings. Do not substitute the figures in this article for household disposable income or real personal consumption expenditures. Answering different questions requires additional datasets tailored to those questions.
How Small Businesses Can Review Sales Assumptions
The points below are operational interpretations rather than forecasts directly calculated from the statistics. Consumer-facing businesses should first inspect recent average order values, purchase frequency, and cancellation or refund trends. Even when macroeconomic indicators move in a particular direction, business performance may vary depending on customer mix and product lineup.
Automatically raising next month's sales forecast simply because weekly earnings increased is premature. Instead, if sales have grown, break down whether the gain was driven by the number of buyers, spending per transaction, or price adjustments. External statistics serve as candidate explanations for internal changes, not definitive proof of causality.
Avoid Assuming Increased Hours Mean Lasting Financial Flexibility
A single month's increase in work hours comes with no guarantee of persistence. Checking in subsequent releases whether hourly metrics recover or whether weekly metrics continue to be driven by hours helps assess the narrative's sustainability. It is best to avoid labeling a single positive shift as a long-term trend.
When budgeting, write down the baseline assumptions alongside the conditions to be verified. Define which internal metrics will confirm whether customer demand is strengthening, and decide which expenditures to review if things do not move as expected. This process establishes a foundation for revising judgments rather than merely trying to predict direction correctly.
A Quick Checklist for Reviewing Headlines
First, verify the release date and the reference month. Second, separate hourly figures from weekly figures. Third, check work hours and the inflation measure used. Finally, noting the difference between your customer base and the statistical sample will clarify the appropriate scope for using the data.
While simple optimistic or pessimistic narratives often form around the trajectory of wages and inflation in the market, this article makes no claim about how strongly any particular group supports either view. Please distinguish between figures verified through public data and suggestions for business operations.
Judgments That Should Be Adjustable at the Next Review
Rather than treating this month's interpretation as a permanent conclusion, record the timestamp of verification and the datasets used. When subsequent data or revisions are released, compare figures that share the same definitions. When assumptions change, being able to articulate what evidence has shifted will make these indicators far more useful for practical decision-making.
This article provides informational context for understanding economic statistics and does not constitute investment advice. A single indicator such as this should not be used to predict specific asset prices, interest rate decisions, or individual company performance.