
U.S. Import Prices +0.3%, Exports -0.6%: The Cost-Revenue Lag Behind China +0.9%
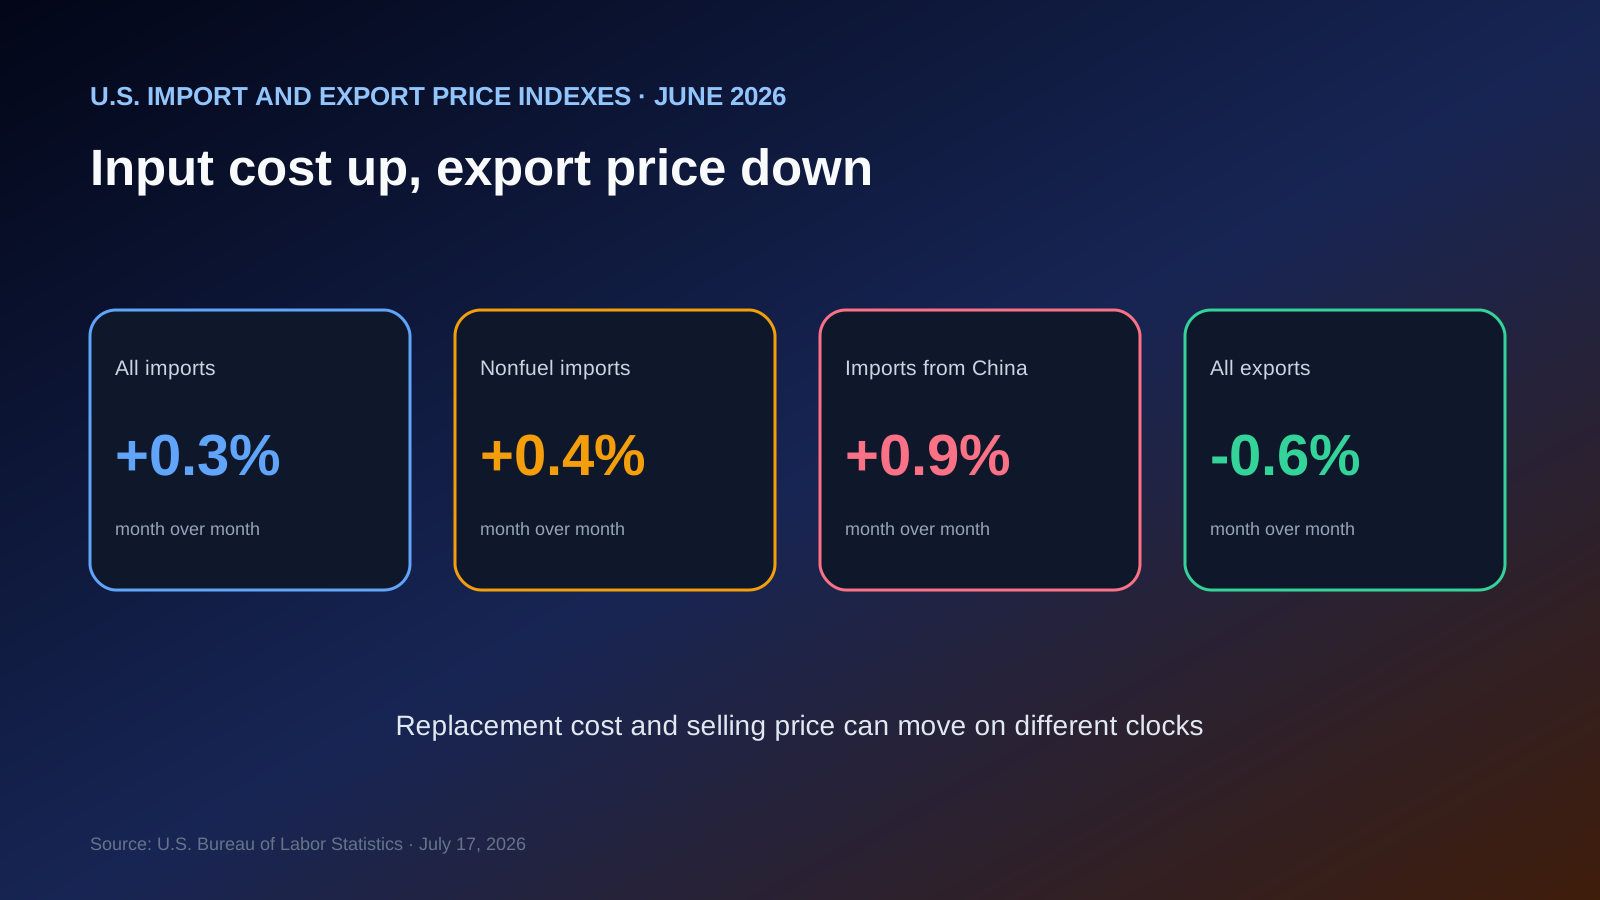
U.S. import prices rose 0.3% in June while export prices fell 0.6%. The composition matters more than the opposite headlines: fuel import prices declined 0.4%, yet nonfuel imports rose 0.4%, and prices for imports from China increased 0.9%. A team that sources abroad can therefore face higher replacement cost while its export selling-price index weakens.
Confirmed facts
BLS reported import prices at +0.3% after +1.7% in May and export prices at -0.6% after +1.2%. Over twelve months, imports rose 7.1% and exports 10.2%. The 0.9% monthly increase for China-origin imports was the largest since January 2008; the annual change was 1.3%.
| June 2026 | MoM | 12 months |
|---|---|---|
| All imports | +0.3% | +7.1% |
| Nonfuel imports | +0.4% | +4.2% |
| Imports from China | +0.9% | +1.3% |
| All exports | -0.6% | +10.2% |
The lag between input and selling prices
Import prices are not consumer prices. Contract currency, hedging, inventory turns, freight, and margin targets determine when and how much cost reaches the customer. The release is therefore better read as a warning about replacement-cost and quote timing than as a direct CPI forecast.
Four signals for small teams
✓Separate supplier quotes by China, North America, and the EU.
✓Model old inventory and replacement inventory with different costs.
✓Compare export discount and FX clauses with domestic pass-through speed.
✓Read July trade-price data alongside CPI and PPI revisions.
Counterarguments and statistical limits
Monthly data are volatile, and June followed large April and May moves. A lower export-price index is not the same as lower export revenue because volume, exchange rates, and product mix also matter. Watch revisions and several months of data. This article is informational and is not financial advice.